本次使用《Python从实际到入门来学习》,如果你也是用的这本书,相信我我帮你少走了很多弯路,可以配合我的笔记来学习
数据可视化:
1.生成数据
可配合Matplotlib 绘图线 | 菜鸟教程 (runoob.com)食用,效果更佳
1.matplotlib基础
数据可视化指的是通过可视化表示来数据探索,它与数据挖掘紧密相关。而数据挖掘指的是通过代码来探索数据集的规矩和关联。数据集可以是用一行代码就能表示的小型数据列表,也可以是数以吉字节的数据。
数据可视化将数据漂亮的、引人注目的简洁方式呈现出来,让观看者可以明白其中含义;
在基因研究、天气研究、政治经济分析等很多领域,大多数都是使用Python来完成数据密集型工作;数据科学家使用了Python编写了一系列的可视化和分析工具,比如matplotlib,它是一个数据绘图库,这里使用它来进行学习
我们还会使用到Pygal包,它专注于生成适合在数字设备上显示的图表,使用它可可在用户于图表交互时突出元素以及调整大小,还可以轻松地调整整个图表尺寸,使其适合在微型智能手表或巨型显示器上显示。
1.1.1 安装matplotlib
pip install matplotlib

##测试,没出现报错就是下载成功了
PS D:\迅雷下载> python
Python 3.8.6 (tags/v3.8.6:db45529, Sep 23 2020, 15:52:53) [MSC v.1927 64 bit (AMD64)] on win32
Type "help", "copyright", "credits" or "license" for more information.
>>> import matplotlib
>>>
1.1.2画个简单的折线图
-
Pyplot 是 Matplotlib 的子库,提供了和 MATLAB 类似的绘图 API。
-
Pyplot 是常用的绘图模块,能很方便让用户绘制 2D 图表。
-
Pyplot 包含一系列绘图函数的相关函数,每个函数会对当前的图像进行一些修改,例如:给图像加上标记,生新的图像,在图像中产生新的绘图区域等等。
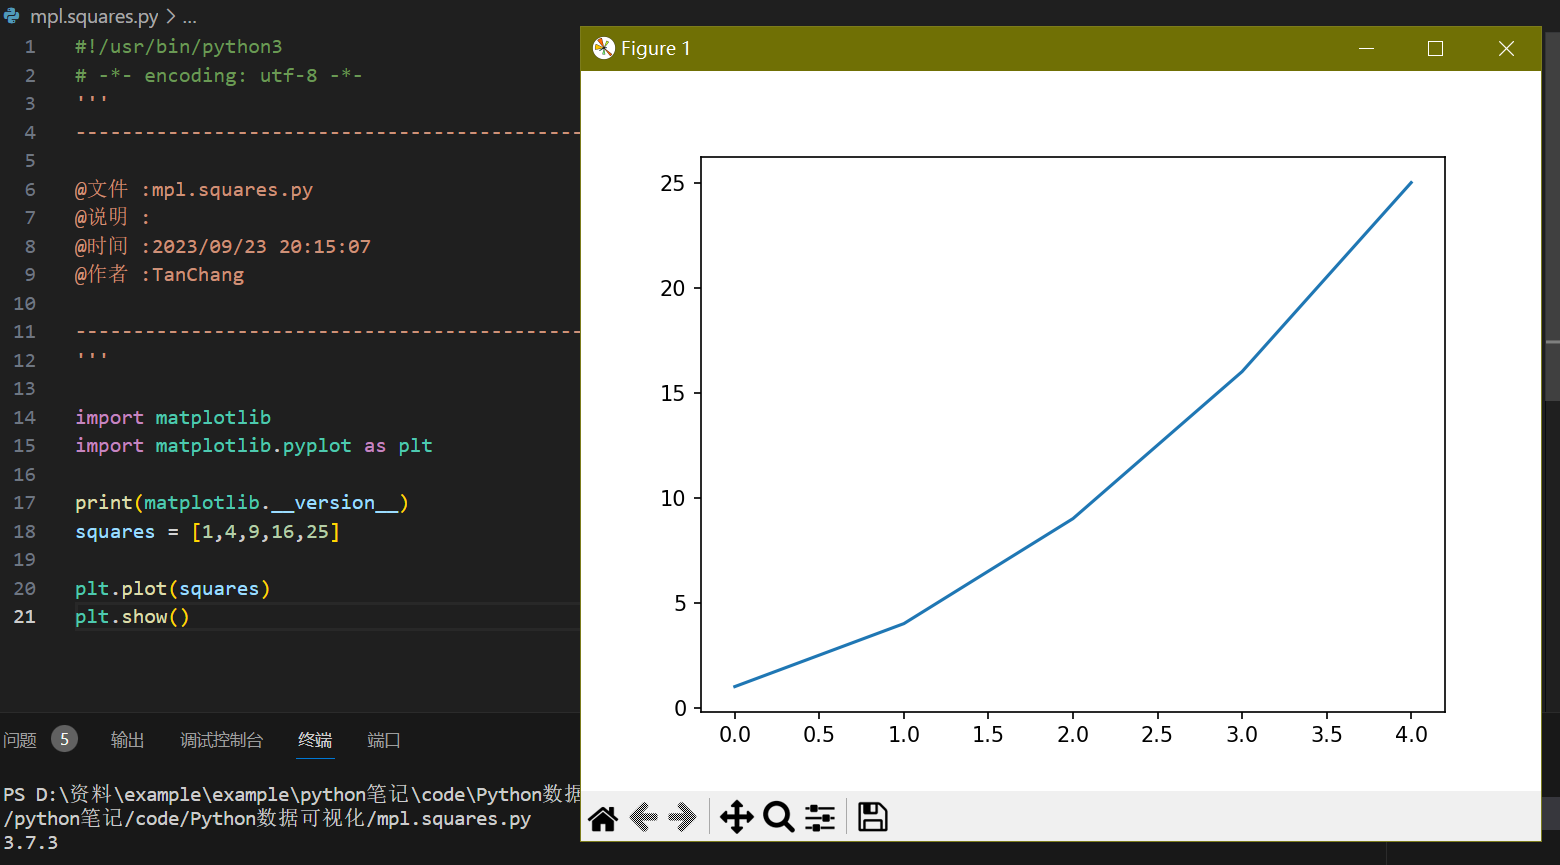
这里我们画一个平方对应表
plt.plot可以用来画线图和散点图,它是绘制二维图形的最基本函数
import matplotlib
##调用matplotlib中的pyplot模块并设置别名plt
import matplotlib.pyplot as plt

##输出matplotlib版本
print(matplotlib.__version__)
##折现图的参数列表,y轴的参数
squares = [1,4,9,16,25]

"""将列表传递给函数plot() """
plt.plot(squares)

"""使用show打开matplotlib查看器,显示绘制的图片"""
plt.show()
1.1.3修改标签文字和线条的粗细
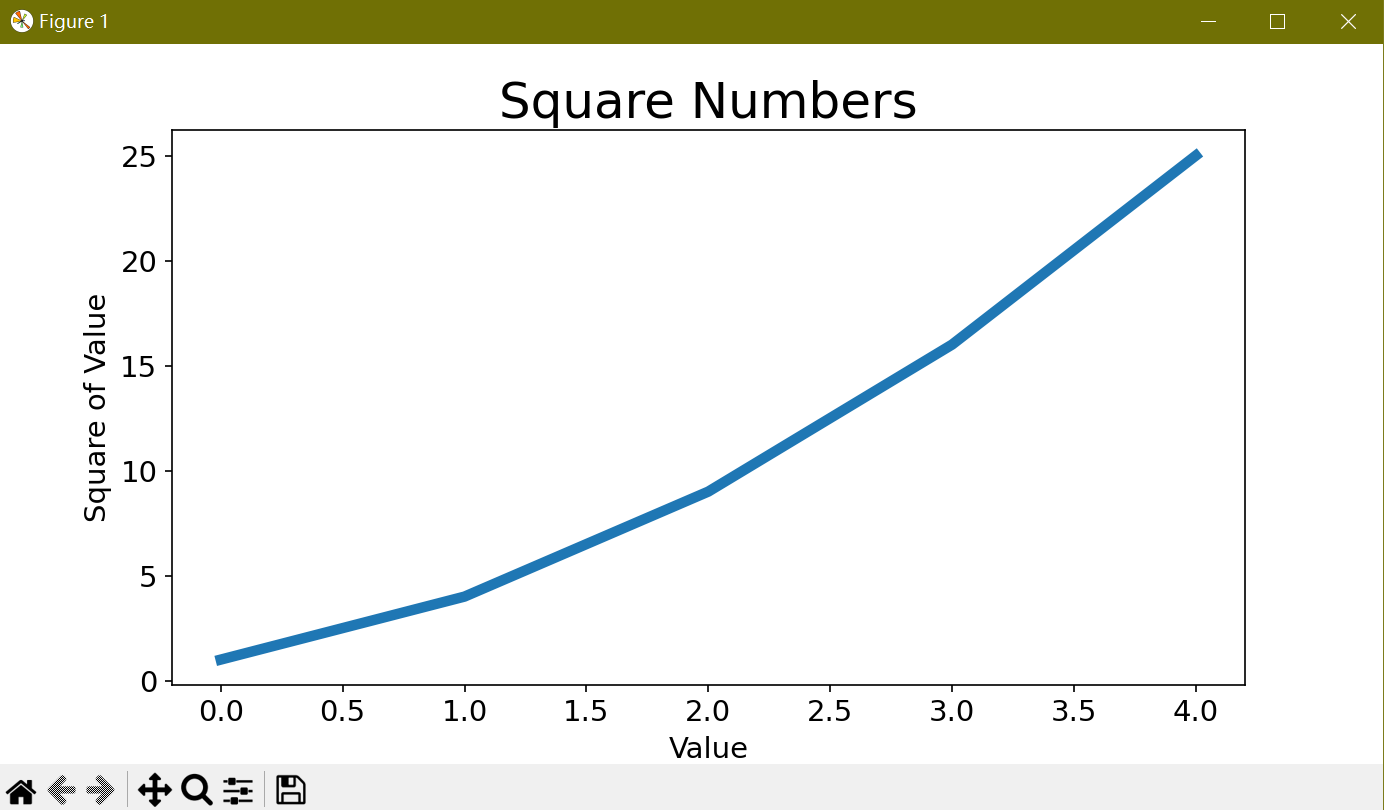
可以进一步在图表中加上x、y轴的坐标名还有图表名,当然也可以见图上的刻度加深一点
....
##折现图的参数列表,也就是y轴的参数
squares = [1,4,9,16,25]

"""将列表传递给函数plot() """
plt.plot(squares,linewidth = 5)

##设置图表标题,并给坐标轴加上标签,fontsize表示为字体大小,x/ylabel表示为x、y轴的标签名
plt.title("Square Numbers",fontsize = 24)
plt.xlabel("Value",fontsize=14)
plt.ylabel("Square of Value",fontsize=14)

###设置刻度标记大小axis参数表示刻度是真假x轴还是y轴,both表示为两者都
plt.tick_params(axis='both',labelsize=14)

"""使用show打开matplotlib查看器,显示绘制的图片"""
plt.show()
1.1.4校正图片
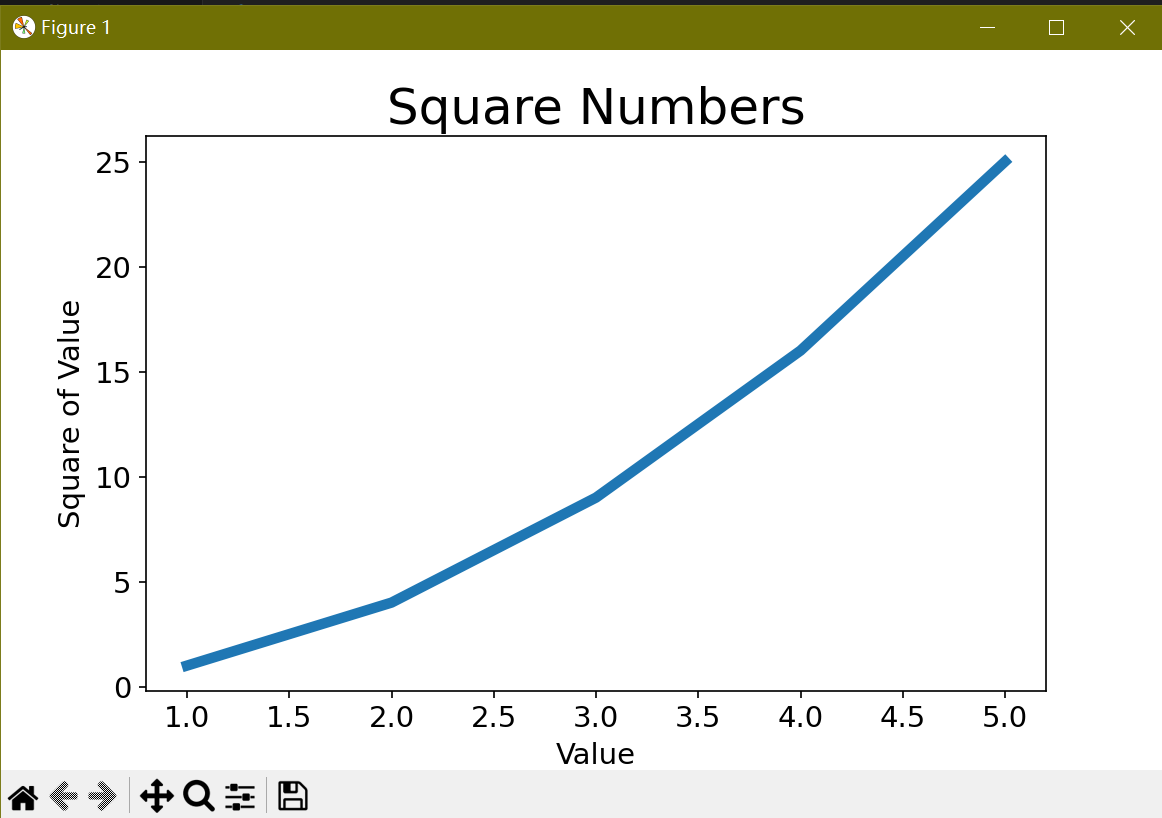
我们看上图的4的平方显示的是25,很明显就是个错误的,我们添加一个对应的x轴坐标来校正这一错误
.....
##x轴列表
input_value = [1,2,3,4,5]

"""将列表传递给函数plot() """
plt.plot(input_value,squares,linewidth = 5)

##设置图表标题,并给坐标轴加上标签,fontsize表示为字体大小,x/ylabel表示为x、y轴的标签名
plt.title("Square Numbers",fontsize = 24)
plt.xlabel("Value",fontsize=14)
plt.ylabel("Square of Value",fontsize=14)

###设置刻度标记大小axis参数表示刻度是真假x轴还是y轴,both表示为两者都
plt.tick_params(axis='both',labelsize=14)。、

"""使用show打开matplotlib查看器,显示绘制的图片"""
plt.show()
1.2.1 使用scatter()绘制散点图
有的时候你想要绘制这种散点图并且还想要设置各个数据点的样式,比如你想使用不同颜色来表示不同的数据,使用scatter可以对每个点都设置同样的样式,再使用不同的样式重新绘制某些点,突出他们
import matplotlib.pyplot as plt

"""传递参数x,y数据"""
plt.scatter(2,4)
plt.show()
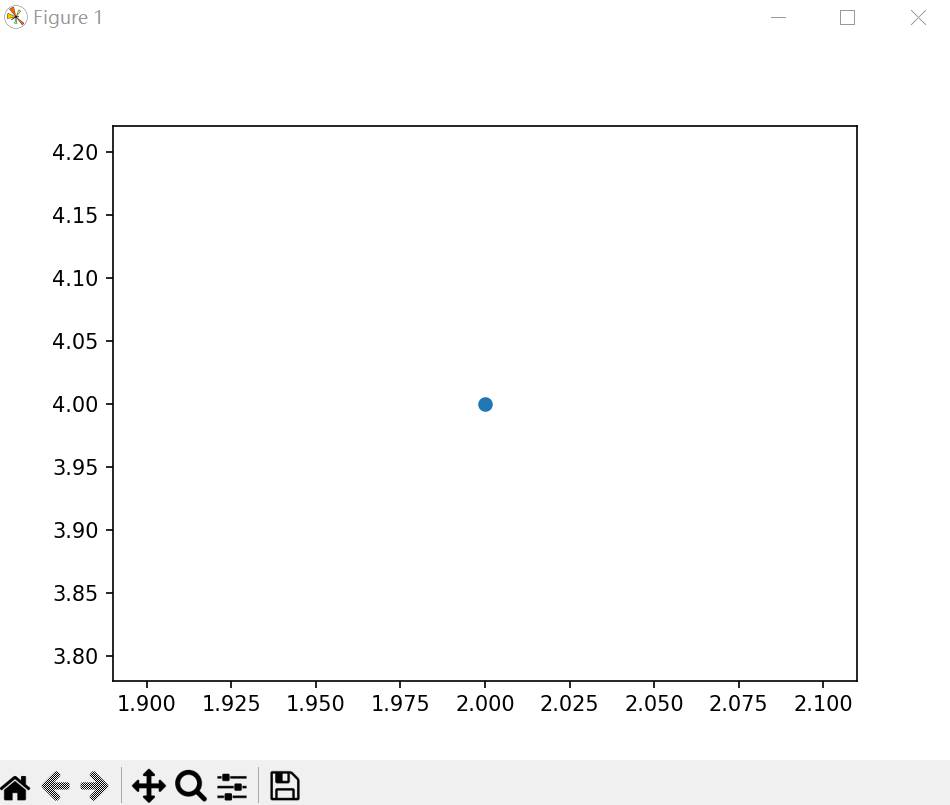
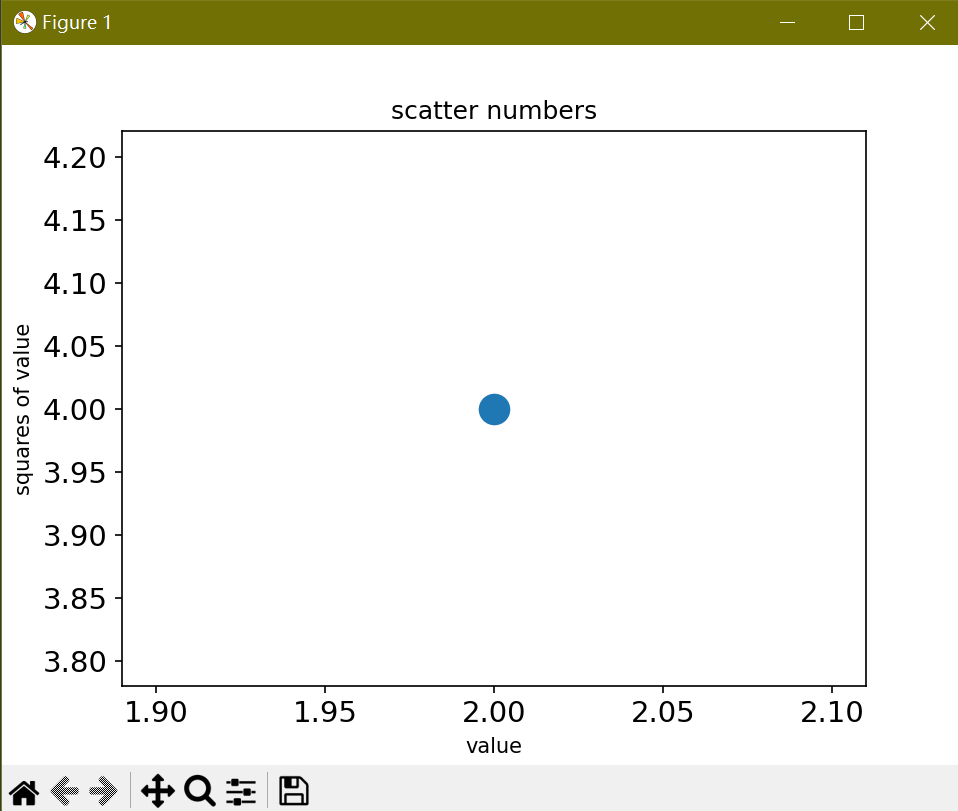
修改一下设置输出的样式,比如添加标题和轴标签,文本设置等
import matplotlib.pyplot as plt

"""传递参数x,y数据,s表示为数据点的大小"""
plt.scatter(2,4,s=200)

"""添加标签、轴标签、设置样式"""
plt.title("scatter numbers")
plt.ylabel("squares of value")
plt.xlabel("value")

"""设置刻度"""
plt.tick_params(axis="both",labelsize=14)

plt.show()
1.2.2绘画一系列的点
import matplotlib.pyplot as plt

"""x,y点数坐标"""
x_values = [1,2,3,4,5]
y_values = [1,4,9,16,25]

"""传递参数x,y数据,s表示为数据点的大小"""
plt.scatter(x_values,y_values,s=100)
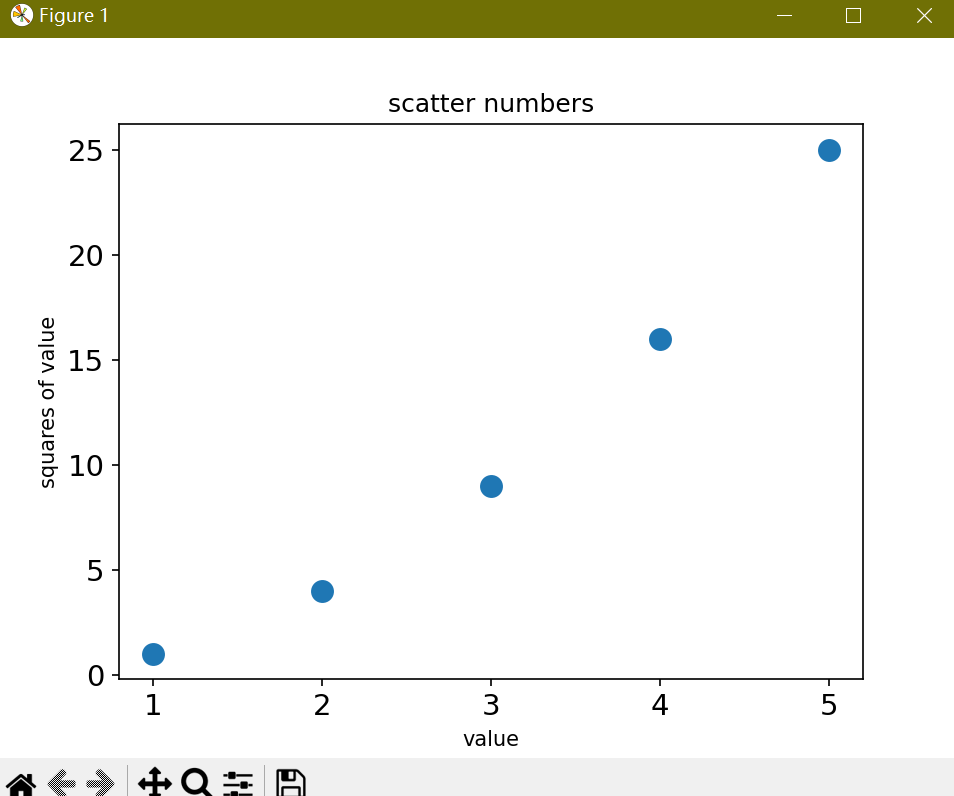
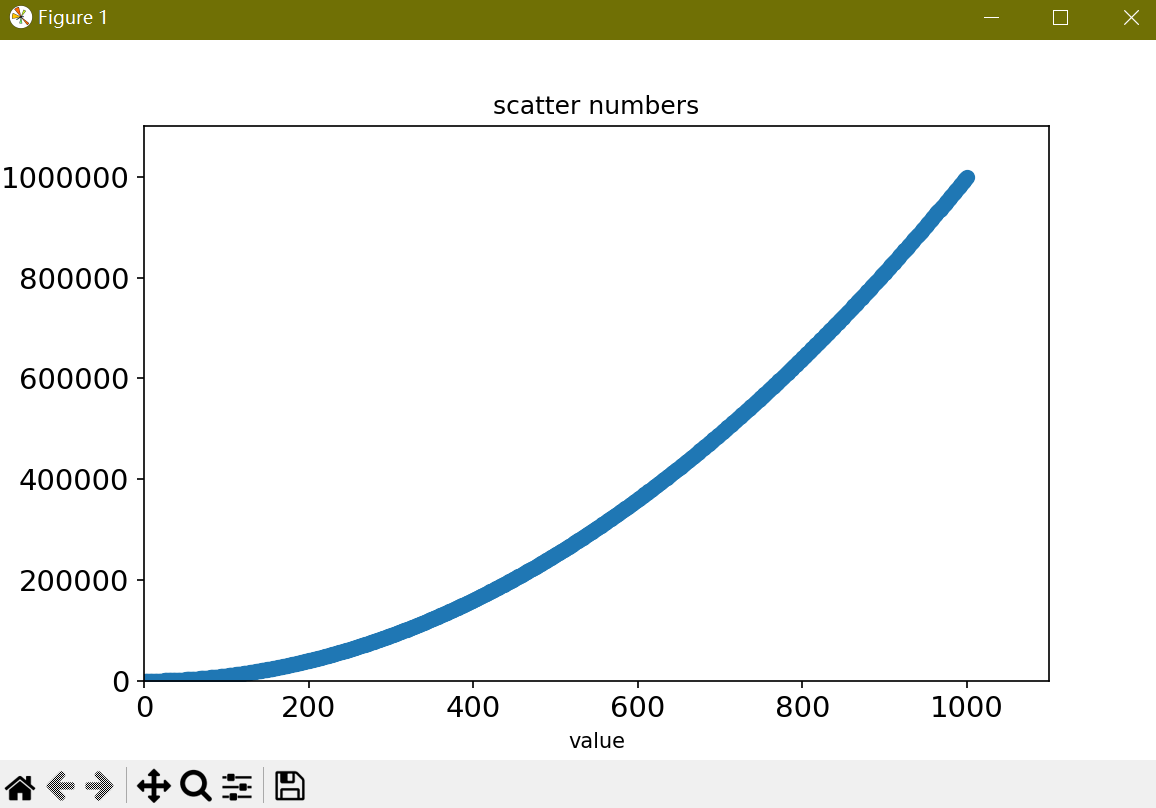
如果是要人工手动求出平方,并输入到图表中去,这样就会很麻烦,我们可以使用一个区间让python自动给我们计算出这个区间内每个数他们的平均值并输入到matplotlib中去
"""设置x轴的区间"""
x_values = list(range(1, 1001))
"""通过x轴来计算平方来计算出y轴"""
y_values = [x**2 for x in x_values]


"""传递参数x,y数据,s表示为数据点的大小"""
plt.scatter(x_values, y_values, s=40)

"""添加标签、轴标签、设置样式"""
plt.title("scatter numbers")
plt.ylabel("squares of value")
plt.xlabel("value")

"""设置刻度"""
plt.tick_params(axis="both", labelsize=14)
"""matplotlib默认是开启科学计数的,使用ticklabel_format关闭科学计数"""
plt.ticklabel_format(style='plain')

plt.axis([0, 1100, 0, 1100000])
1.2.3删除数据点的轮廓
"""传递参数x,y数据,s表示为数据点的大小"""
plt.scatter(x_values, y_values,edgecolors='none', s=40)
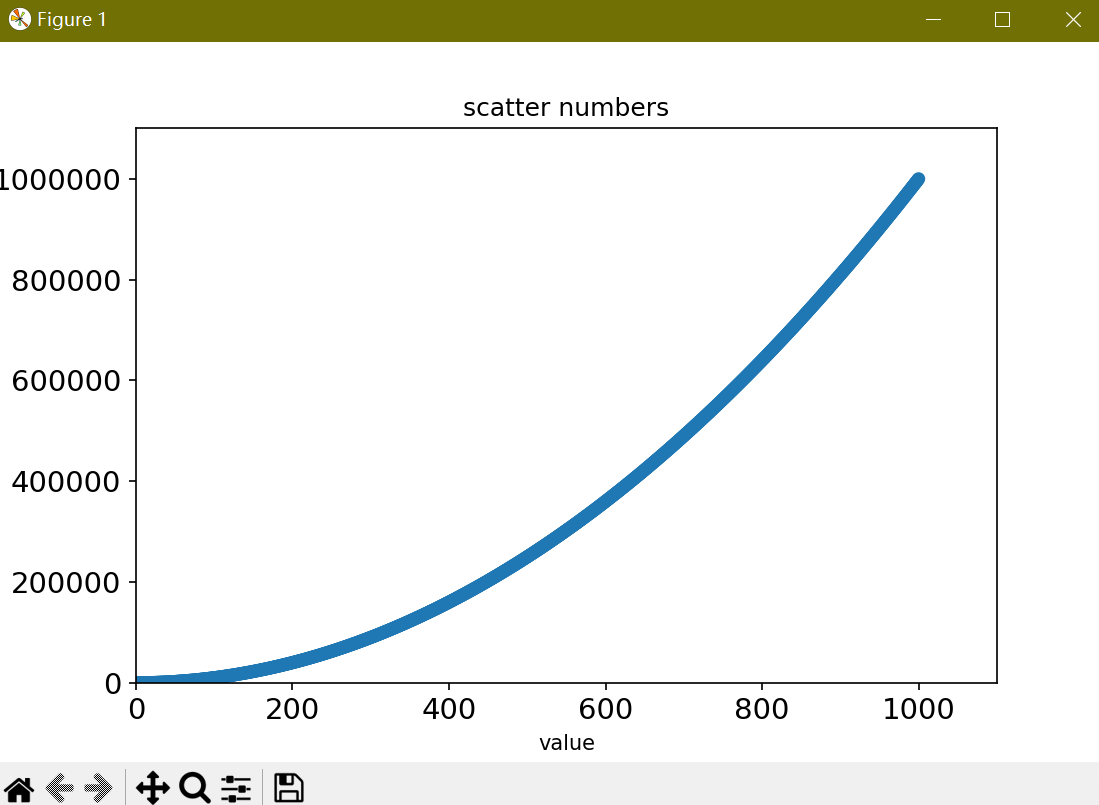
1.2.4自定义数据点的颜色
"""
传递参数x,y数据,s表示为数据点的大小
传递参数“c”点的颜色,默认蓝色 'b',也可以是个 RGB 或 RGBA 二维行数组
edgecolors::颜色或颜色序列,默认为 'face',可选值有 'face', 'none', None。
cmap:Colormap,默认 None,标量或者是一个 colormap 的名字,只有 c 是一个浮点数数组的时才使用。如果没有申明就是 image.cmap
它会将y轴较小的值显示为浅蓝色,y轴较大的就会深蓝色
"""
plt.scatter(x_values, y_values,c=y_values,cmap=plt.cm.Blues,edgecolors='none', s=40)
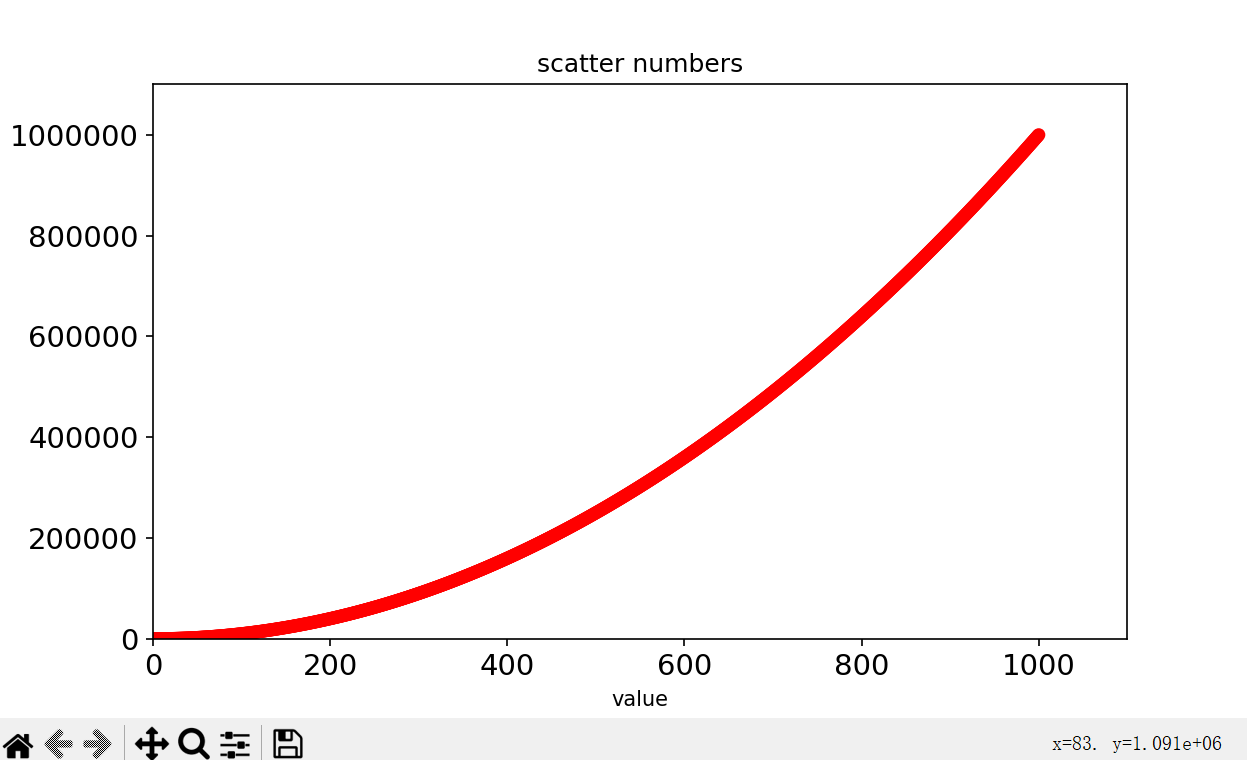
还可以使用RGB参数来调节
plt.scatter(x_values, y_values,c=(0,0,0),edgecolors='none', s=40)
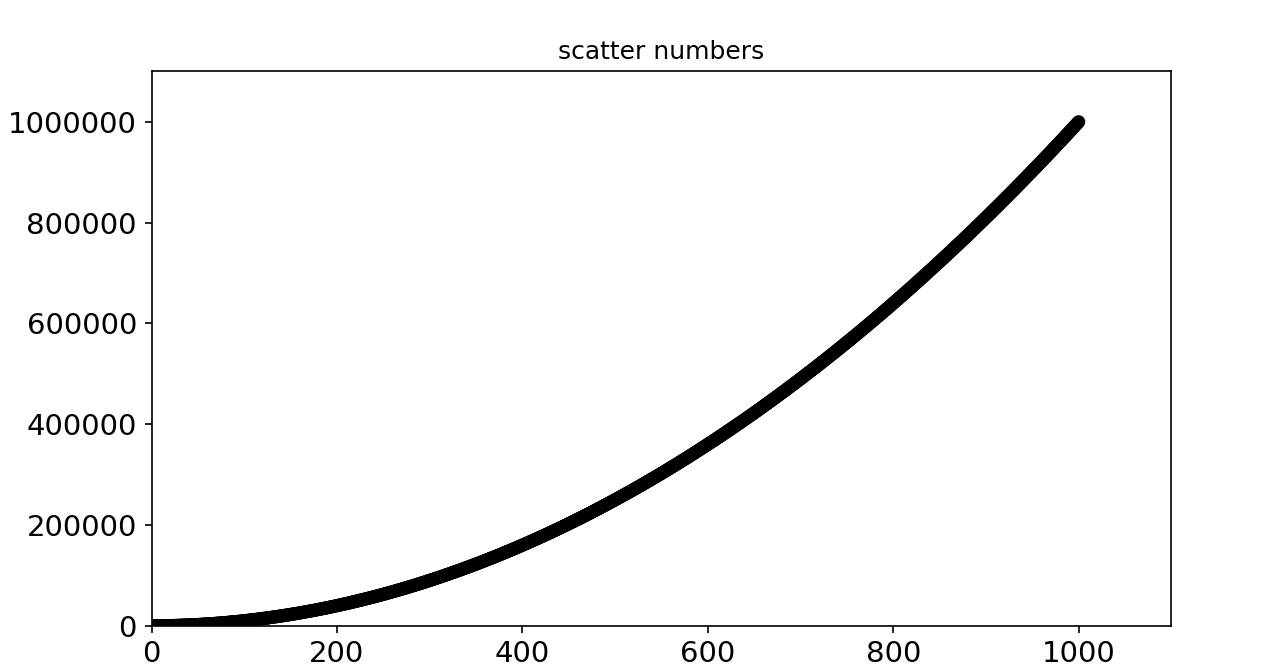
1.2.5使用颜色的映射
颜色映射可以理解为渐变,从起始的颜色渐变到较深的颜色结束,颜色映射可以突出数据的规律;列如可以用颜色较浅的值来显示较小的值,颜色较深的就可以显示较大的值;
"""
传递参数x,y数据,s表示为数据点的大小
传递参数“c”点的颜色,默认等于,可以变化为'r'红色,'m' 洋红色,'g' 绿色,'y' 黄色,'r' 红色,'k' 黑色,'w' 白色,'c' 青绿色,也可以是个 RGB 或 RGBA 二维行数组
edgecolors::颜色或颜色序列,默认为 'face',可选值有 'face', 'none', None。
cmap:Colormap,默认 None,标量或者是一个 colormap 的名字,只有 c 是一个浮点数数组的时才使用。如果没有申明就是 image.cmap,这里就是高数camp使用蓝色来映射
它会将y轴较小的值显示为浅蓝色,y轴较大的就会深蓝色
"""
plt.scatter(x_values, y_values,c=y_values,cmap=plt.cm.Blues,edgecolors='none', s=40)
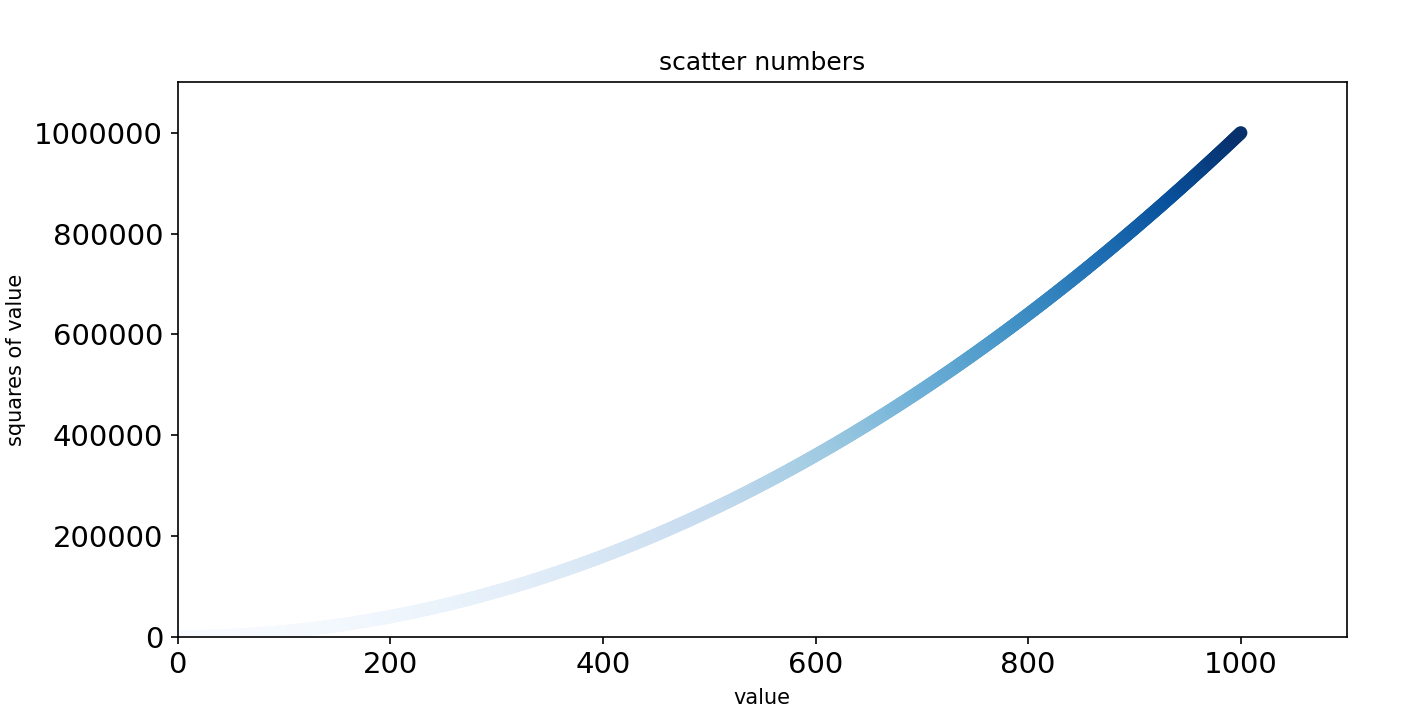
1.2.6自动保存图表
可以让程序自动保存生成的图表将show()的调用改为savefig()的调用即可
"""第一个参数就是指定名字,第二个就是裁剪多余部分"""
plt.savefig('scatter_squares.png',bbox_inches ='tight')
练习题
15-1
#!/usr/bin/python3
# -*- encoding: utf-8 -*-
'''
-----------------------------------------------------------------

@文件 :15-1.py
@说明 :
@时间 :2023/09/24 19:30:31
@作者 :TanChang

------------------------------------------------------------------
'''

import matplotlib.pyplot as plt

x_value = list(range(1,6))
y_value = [x**3 for x in x_value]
print(y_value)

plt.plot(x_value,y_value)
plt.show()


------------------------------


#!/usr/bin/python3
# -*- encoding: utf-8 -*-
'''
-----------------------------------------------------------------

@文件 :15-1.py
@说明 :
@时间 :2023/09/24 19:30:31
@作者 :TanChang

------------------------------------------------------------------
'''

import matplotlib.pyplot as plt

x_value = list(range(1,5000))
y_value = [x**3 for x in x_value]
print(y_value)

plt.plot(x_value,y_value)
plt.show()
15-2
import matplotlib.pyplot as plt

x_value = list(range(1,5000))
y_value = [x**3 for x in x_value]

plt.scatter(x_value,y_value,c=y_value,cmap=plt.cm.Reds)
plt.show()
2.随机漫步
在Matplotlib中,"漫步数据"通常指的是随机漫步数据(Random Walk Data)。随机漫步数据是一种模拟随机过程的数据,其中每一步的值是根据某种随机规则生成的。
在随机漫步数据中,起始点通常被设置为零或其他初始值,然后根据一定的规则,以随机的方向和步幅进行移动。每一步的移动是根据随机变量生成的,可以是服从某种概率分布的随机数。随机漫步数据的路径是随机的,每次漫步的结果依赖于前一步的结果。
随机漫步数据在数据可视化和模拟实验中经常使用。在Matplotlib中,可以使用随机数生成器函数(如numpy.random模块中的函数)生成随机漫步数据,然后使用Matplotlib绘制出这些数据的图表,以便进行分析和展示。
2.1创建RandomWalk()类
RandomWalk类它是随机的选择前进方向;而且这个类需要三个属性,其中一个是存储随机漫步次数的变量,其他两个是列表,分别存储经过的每个点x,y的坐标
且它只包含两个功能_init_()和fill_walk()
#!/usr/bin/python3
# -*- encoding: utf-8 -*-
'''
-----------------------------------------------------------------

@文件 :radom_walk.py
@说明 :
@时间 :2023/09/24 21:09:34
@作者 :TanChang

------------------------------------------------------------------
'''
"""
每次漫步做决策时都使用choice()来做决策
random.choice() 是 Python 中 random 模块提供的一个函数,用于从给定的序列中随机选择一个元素作为结果返回
"""
from random import choice


class RandomWalk():

    """定义随机漫步次数"""
    def __init__(self,num_point=5000):
        """初始化随机漫步的属性"""

        """存储漫步次数"""
        self.num_point = num_point

        """配置所有随机漫步坐标都始于0"""
        self.x_value = [0]
        self.y_value = [0]
2.2选择方向
    def fill_walk(self):
        """计算随机漫步包含的所有点"""

        """不断漫步,直到列表达到指定的长度"""
        while len(self.x_value) < self.num_point:
            """决定前进的方向以及沿着这个方向前进"""
            """x设置,其中x_dir和x_dis表示的都为随机选择的一个数,每次循环都会由choice随机选择一个数,x_step就是移动的方向"""
            x_direction = choice([1,-1])
            x_distance = choice([0,1,2,3,4])
            x_step = x_direction * x_distance

            """与x设置同理"""
            y_direction = choice([1,-1])
            y_distance = choice([0,1,2,3,4])
            y_step = y_direction * y_distance


            """如果x和y轴都为0,也就是他们两都不动,原地踏步,这样不行,我们跳过这个循环"""
            if x_step == 0 and y_step == 0:
                continue


            """计算下一个点的x和y值,将列表中的最后以为和"""
            next_x = self.x_value[-1] + x_step
            next_y = self.y_value[-1] + y_step

            """将计算好的坐标导入到x,y内"""
            self.x_values.append(next_x)
            self.y_values.append(next_y)
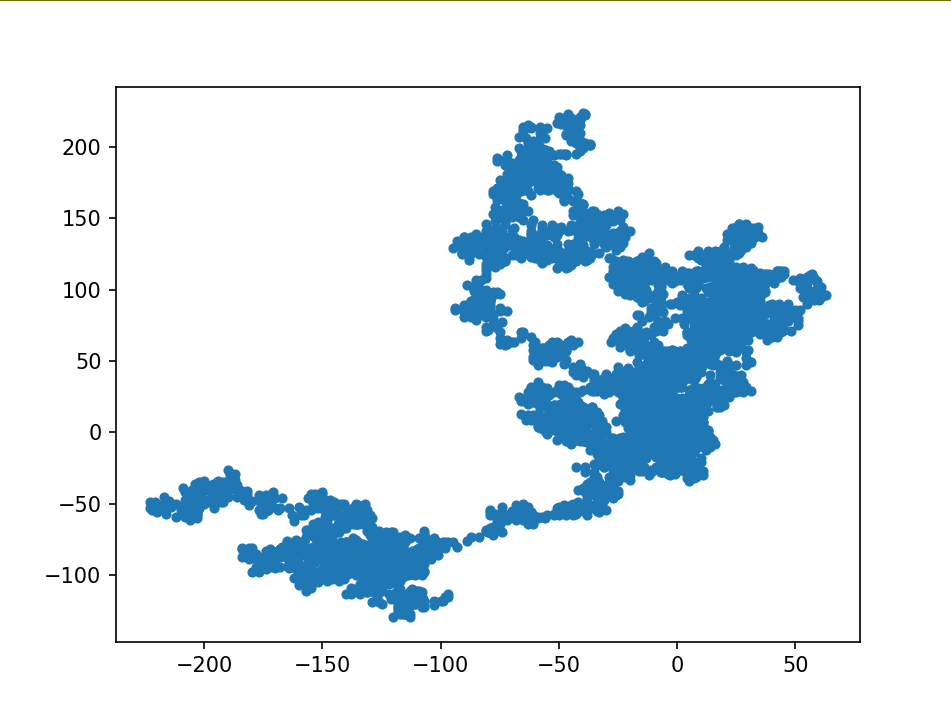
2.2.3绘制随机漫步图
#!/usr/bin/python3
# -*- encoding: utf-8 -*-
'''
-----------------------------------------------------------------
@文件 :rw_visual.py
@说明 :
@时间 :2023/09/24 21:57:43
@作者 :TanChang
------------------------------------------------------------------
'''
import matplotlib.pyplot as plt
from random_walk import RandomWalk
##将RandomWalk类导入到rw
rw = RandomWalk()
"""调用移动坐标"""
rw.fill_walk()
plt.scatter(rw.x_value,rw.y_value,s=15)
plt.show()
2.2.4模拟多次漫步
因为每次漫步都不同,所有每次漫步都可能产生不同的图片,我们可以使用在当前程序中不中断运行的情况下多次生成不同的图片
method one:

rw_visual.py

##使程序循环
while True:
    ##将RandomWalk类导入到rw
    rw = RandomWalk()
    """调用移动坐标"""
    rw.fill_walk()
    plt.scatter(rw.x_value,rw.y_value,s=15)
    plt.show()
    ##判断如果用户输入的使y就继续循环,不是则结束
    keep_running = input("是否继续生成呢?(y/n):")
    if keep_running == 'n':
        print("程序结束")
        break

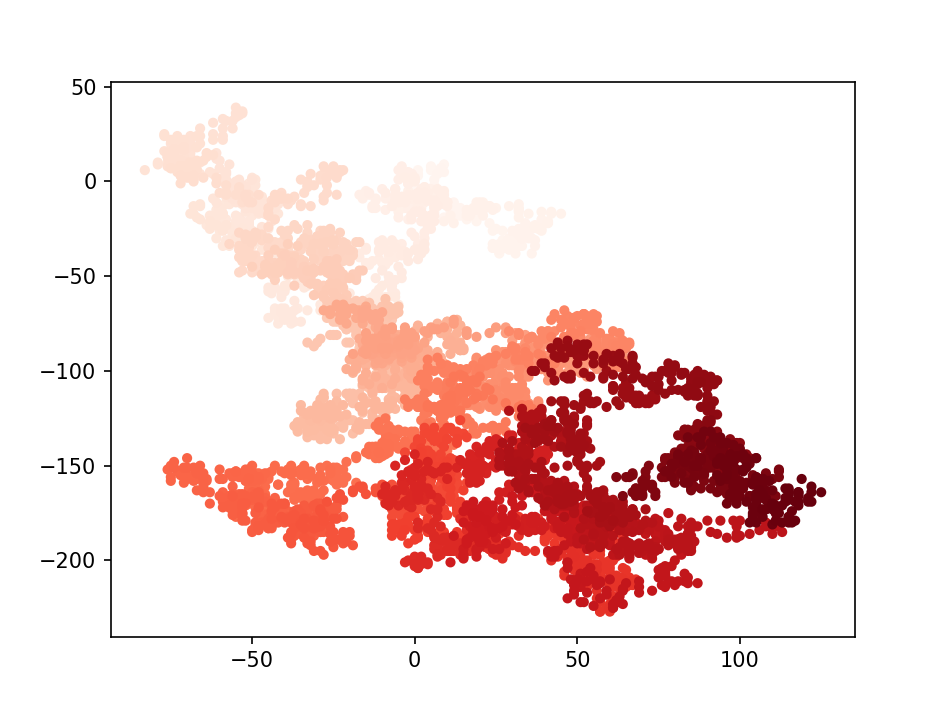
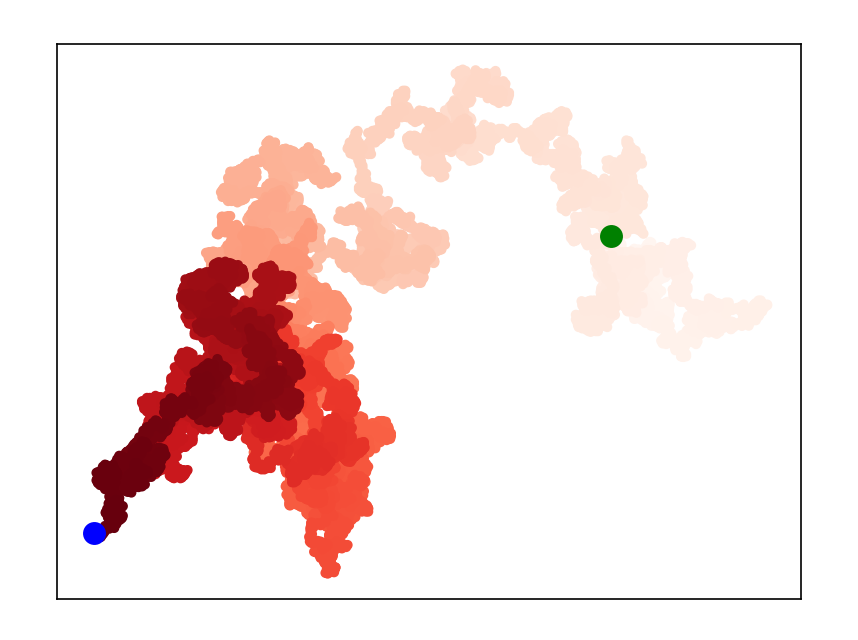
2.2.5随机点渐变
rw_visual.py


    """调用移动坐标"""
    rw.fill_walk()

    """将random_walk内的point点数以列表方式传给point_numbers参数,最后在传递给c参数"""
    point_numbers = list(range(rw.num_point))
    plt.scatter(rw.x_value,rw.y_value,c=point_numbers,cmap=plt.cm.Reds,edgecolors=None,s=15)
    plt.show()
2.2.6调节初始点位
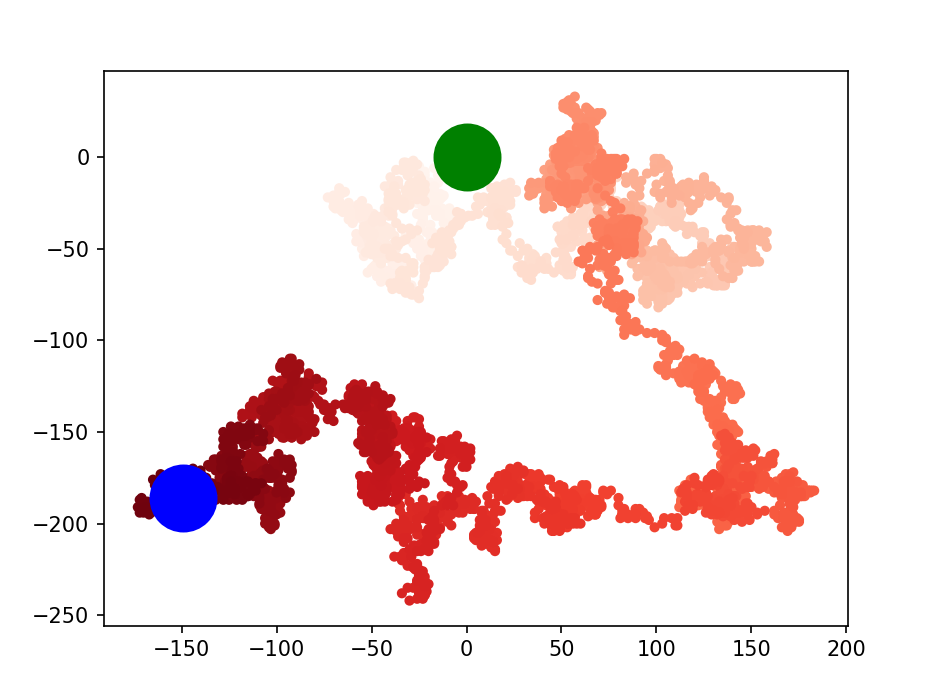
我们可以调节初始点位,让它比其他点位更加突出
rw_visual.py


    """x轴最后一个点突出,将0,0坐标点突出"""
    plt.scatter(rw.x_value,rw.y_value,c=point_numbers,cmap=plt.cm.Reds,edgecolors=None,s=15)
    plt.scatter(0,0,c='green',s=1000,edgecolors=None)
    plt.scatter(rw.x_value[-1],rw.y_value[-1],c='blue',s=1000,edgecolors=None)
    plt.show()
2.2.7隐藏坐标轴
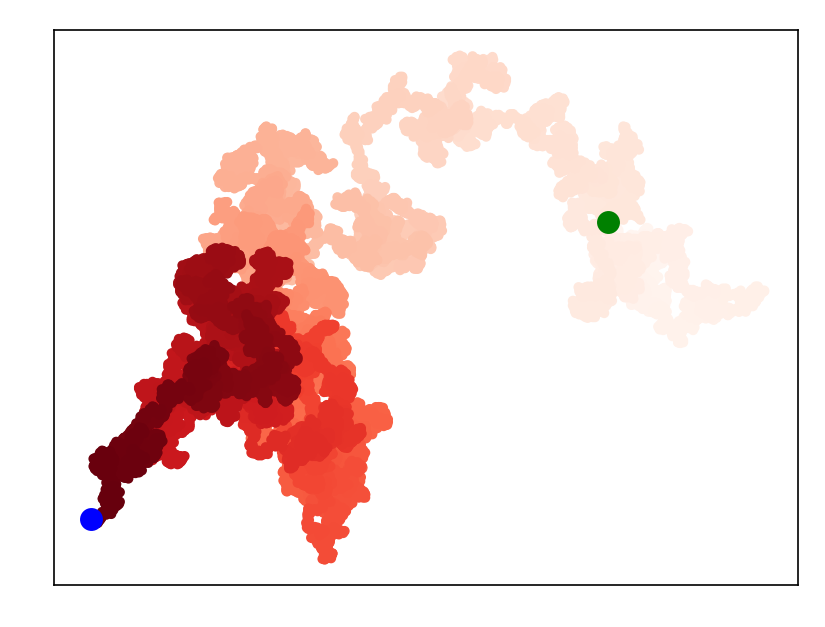
rw_visual.py

    ##注意这里一定要赋值且在绘画之前使用关闭
    current_axes = plt.axes()
    current_axes.get_xaxis().set_visible(False)
    current_axes.get_yaxis().set_visible(False)

    """将random_walk内的point点数以列表方式传给point_numbers参数,最后在传递给c参数"""
    point_numbers = list(range(rw.num_point))

    """x轴最后一个点突出,将0,0坐标点突出"""
    plt.scatter(rw.x_value,rw.y_value,c=point_numbers,cmap=plt.cm.Reds,edgecolors=None,s=15)
    plt.scatter(0,0,c='green',s=1000,edgecolors=None)
    plt.scatter(rw.x_value[-1],rw.y_value[-1],c='blue',s=1000,edgecolors=None)
2.2.8增加数量
rw_visual.py


##使程序循环
while True:
    """修改漫步的最大点数"""
    ##将RandomWalk类导入到rw
    rw = RandomWalk(50000)
    """调用移动坐标"""
    rw.fill_walk()
    """隐藏坐标轴"""
    current_axes = plt.axes()
2.2.9调整屏幕尺寸
rw_visual.py


    """调用移动坐标"""
    rw.fill_walk()

    """调整屏幕大小"""
    plt.figure(figsize=(10,6),dpi=1080)
    """隐藏坐标轴"""
    current_axes = plt.axes()
2练习题
15-3:


#!/usr/bin/python3
# -*- encoding: utf-8 -*-
'''
-----------------------------------------------------------------

@文件 :rw_visual_2.py
@说明 :
@时间 :2023/09/25 22:06:57
@作者 :TanChang

------------------------------------------------------------------
'''


import matplotlib.pyplot as plt
from random_walk import RandomWalk

##使程序循环
while True:
    """修改漫步的最大点数"""
    ##将RandomWalk类导入到rw
    rw = RandomWalk(5000)
    """调用移动坐标"""
    rw.fill_walk()

    """调整屏幕大小"""
    plt.figure(figsize=(6,6),dpi=120)
    """隐藏坐标轴"""
    current_axes = plt.axes()
    current_axes.get_xaxis().set_visible(False)
    current_axes.get_yaxis().set_visible(False)

    """将random_walk内的point点数以列表方式传给point_numbers参数,最后在传递给c参数"""
    point_numbers = list(range(rw.num_point))
    plt.plot(rw.x_value,rw.y_value,linewidth = 5)
    """x轴最后一个点突出,将0,0坐标点突出"""
    # plt.scatter(rw.x_value,rw.y_value,c=point_numbers,cmap=plt.cm.Reds,edgecolors=None,s=1)
    # plt.scatter(0,0,c='green',s=100,edgecolors=None)
    # plt.scatter(rw.x_value[-1],rw.y_value[-1],c='blue',s=100,edgecolors=None)


    plt.show()
    ##判断如果用户输入的使y就继续循环,不是则结束
    keep_running = input("是否继续生成呢?(y/n):")
    if keep_running == 'n':
        print("程序结束")
        break

15-4:
random_walk_2.py

from random import choice


class RandomWalk():

    """定义随机漫步次数"""
    def __init__(self,num_point=5000):
        """初始化随机漫步的属性"""

        """存储漫步次数"""
        self.num_point = num_point

        """配置所有随机漫步坐标都始于0"""
        self.x_value = [0]
        self.y_value = [0]

    def fill_walk(self):
        """计算随机漫步包含的所有点"""

        """不断漫步,直到列表达到指定的长度"""
        while len(self.x_value) < self.num_point:
            """决定前进的方向以及沿着这个方向前进"""
            """x设置,其中x_dir和x_dis表示的都为随机选择的一个数,每次循环都会由choice随机选择一个数,x_step就是移动的方向"""
            x_direction = choice([1,-1])
            x_distance = choice([0,1,2,3,4,5,6,7,8,9])
            x_step = x_direction * x_distance

            """与x设置同理"""
            y_direction = choice([1,-1])
            y_distance = choice([0,1,2,3,4,5,6,7,8,9])
            y_step = y_direction * y_distance


            """如果x和y轴都为0,也就是他们两都不动,原地踏步,这样不行,我们跳过这个循环"""
            if x_step == 0 and y_step == 0:
                continue


            """计算下一个点的x和y值,将列表中的最后以为和"""
            next_x = self.x_value[-1] + x_step
            next_y = self.y_value[-1] + y_step

            """将计算好的坐标导入到x,y内"""
            self.x_value.append(next_x)
            self.y_value.append(next_y)
15-5:

rw_visual.py


from random import choice


class RandomWalk():

    """定义随机漫步次数"""
    def __init__(self,num_point=5000):
        """初始化随机漫步的属性"""

        """存储漫步次数"""
        self.num_point = num_point

        """配置所有随机漫步坐标都始于0"""
        self.x_value = [0]
        self.y_value = [0]

    def fill_walk(self):
        """计算随机漫步包含的所有点"""

        """不断漫步,直到列表达到指定的长度"""
        while len(self.x_value) < self.num_point:
            """决定前进的方向以及沿着这个方向前进"""
            x_step = self.get_step()
            y_step = self.get_step()

            """如果x和y轴都为0,也就是他们两都不动,原地踏步,这样不行,我们跳过这个循环"""
            if x_step == 0 and y_step == 0:
                continue


            """计算下一个点的x和y值,将列表中的最后以为和"""
            next_x = self.x_value[-1] + x_step
            next_y = self.y_value[-1] + y_step

            """将计算好的坐标导入到x,y内"""
            self.x_value.append(next_x)
            self.y_value.append(next_y)
    def get_step(self):
            """x设置,其中x_dir和x_dis表示的都为随机选择的一个数,每次循环都会由choice随机选择一个数,x_step就是移动的方向"""
            """计算移动速度"""
            direction = choice([1,-1])
            distance = choice([0,1,2,3,4])
            self.step = direction * distance
            return self.step
3.使用Pygal模拟掷骰子
pygal也是一个可视化的库,它可以生成可缩放的矢量图像文件,用在不同尺寸的屏幕上效果更好
PS C:\Users\tanchang> pip3 install --user pygal
Looking in indexes: https://mirrors.aliyun.com/pypi/simple/
Collecting pygal
  Downloading https://mirrors.aliyun.com/pypi/packages/e2/34/aa8cafcdf57058c080f64e5205eaed2ed523aec0d6519a92aec250189079/pygal-3.0.0-py2.py3-none-any.whl (129 kB)
     ━━━━━━━━━━━━━━━━━━━━━━━━━━━━━━━━━━━━━━━━ 129.4/129.4 kB 1.9 MB/s eta 0:00:00
Installing collected packages: pygal
Successfully installed pygal-3.0.0
本次将跟随书上来模拟一个掷骰子的场景
#!/usr/bin/python3
# -*- encoding: utf-8 -*-
'''
-----------------------------------------------------------------

@文件 :die.py
@说明 :
@时间 :2023/09/26 14:33:46
@作者 :TanChang

------------------------------------------------------------------
'''


from random import randint

class Die():
    """表示一个骰子的类"""
    def __init__(self,num_sides=6):
        """骰子为6面"""
        self.num_sides = num_sides

    def roll(self):
        """返回一个1到6之间的任何值"""
        return randint(1,self.num_sides)
#!/usr/bin/python3
# -*- encoding: utf-8 -*-
'''
-----------------------------------------------------------------

@文件 :die_visual.py
@说明 :
@时间 :2023/09/26 14:33:20
@作者 :TanChang

------------------------------------------------------------------
'''

from die import Die

"""调用骰子"""
die = Die()

"""创建列表将多次投骰子的结果加入到列表并输出"""
results = []
for roll_num in range(100):
    result = die.roll()
    results.append(result)

print(results)
结果:
[1, 4, 3, 2, 6, 4, 3, 6, 6, 1, 4, 6, 2, 3, 2, 2, 2, 1, 2, 4, 6, 6, 3, 6, 4, 1, 5, 5, 6, 6, 5, 2, 3, 6, 3, 3, 5, 3, 5, 1, 5, 1, 3, 4, 3, 2, 1, 4, 4, 3, 6, 4, 4, 5, 5, 3, 5, 2, 4, 2, 4, 4, 3, 6, 5, 4, 2, 4, 3, 3, 4,
1, 1, 5, 4, 4, 2, 4, 2, 3, 3, 5, 1, 1, 3, 4, 6, 3, 6, 1, 5, 1, 1, 2, 2, 4, 2, 5, 4, 4]
3.1计算这几个数出现的次数
这里把投骰子的次数增加了
from die import Die

"""调用骰子"""
die = Die()

"""创建列表将多次投骰子的结果加入到列表并输出"""
results = []
for roll_num in range(1000):
    result = die.roll()
    results.append(result)

analysis_result = []
"""按照顺序读取然后计算他们出现的次数"""
for value in range(1,die.num_sides+1):
    """使用count来计算出现次数并赋予analysis"""
    analysis = results.count(value)
    analysis_result.append(analysis)

print(analysis_result)
结果:
[168, 162, 163, 184, 159, 164]
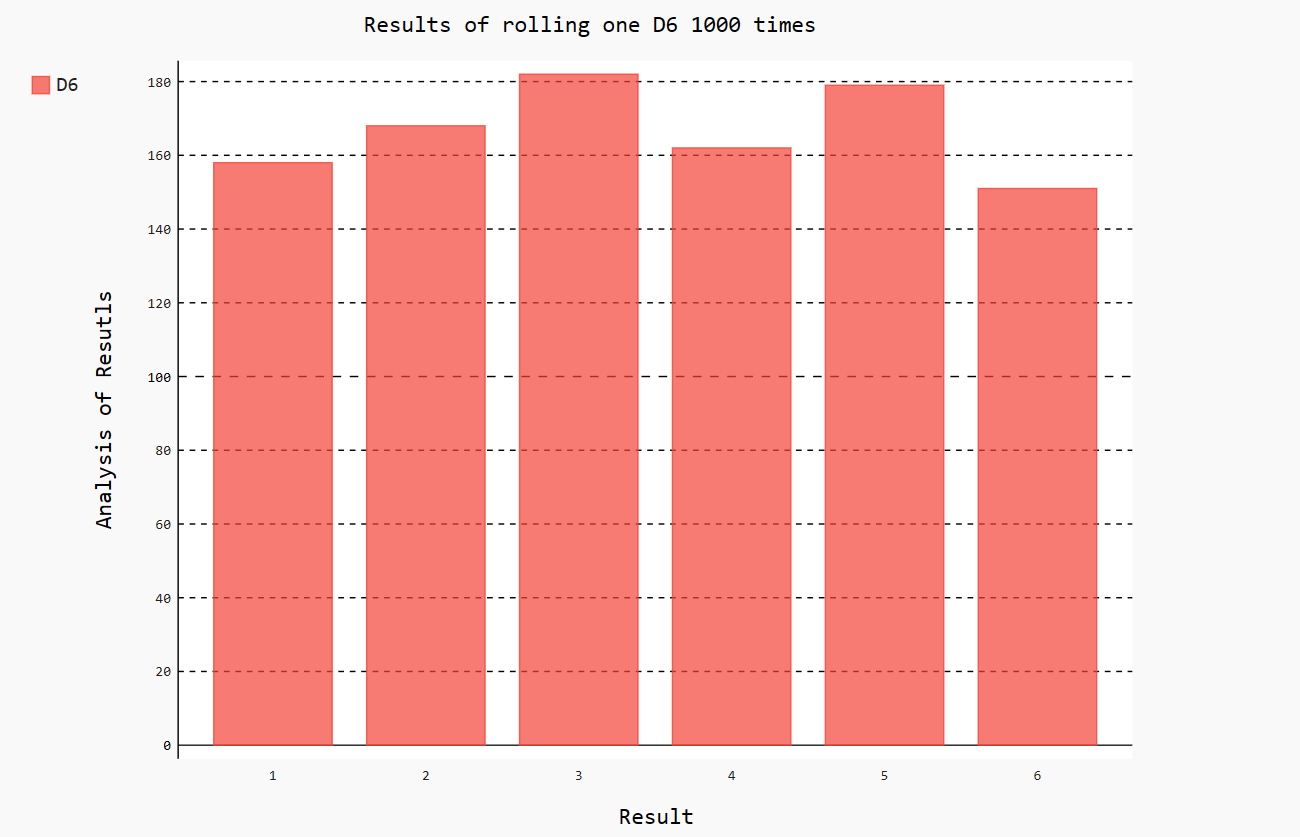
3.2绘制直方图
将分析结果得到后,就可以利用这个结果来画出直方图更加直观的看到信息,这里就需要使用到pygal,来画直方图
analysis_result = []
"""按照顺序读取然后计算他们出现的次数"""
for value in range(1,die.num_sides+1):
    """使用count来计算出现次数并赋予analysis"""
    analysis = results.count(value)
    analysis_result.append(analysis)

"""创建一个pygal.Bar实列"""
hist = pygal.Bar()

"""设置图主标签和各个值的标签"""
hist.title = "Results of rolling one D6 1000 times"
hist.x_labels = list(range(1,7))
hist.x_title = "Result"
hist.y_title = "Analysis of Resutls"

"""设置数据名"""
hist.add('D6',analysis_result)
hist.render_to_file('die_disvual.svg')
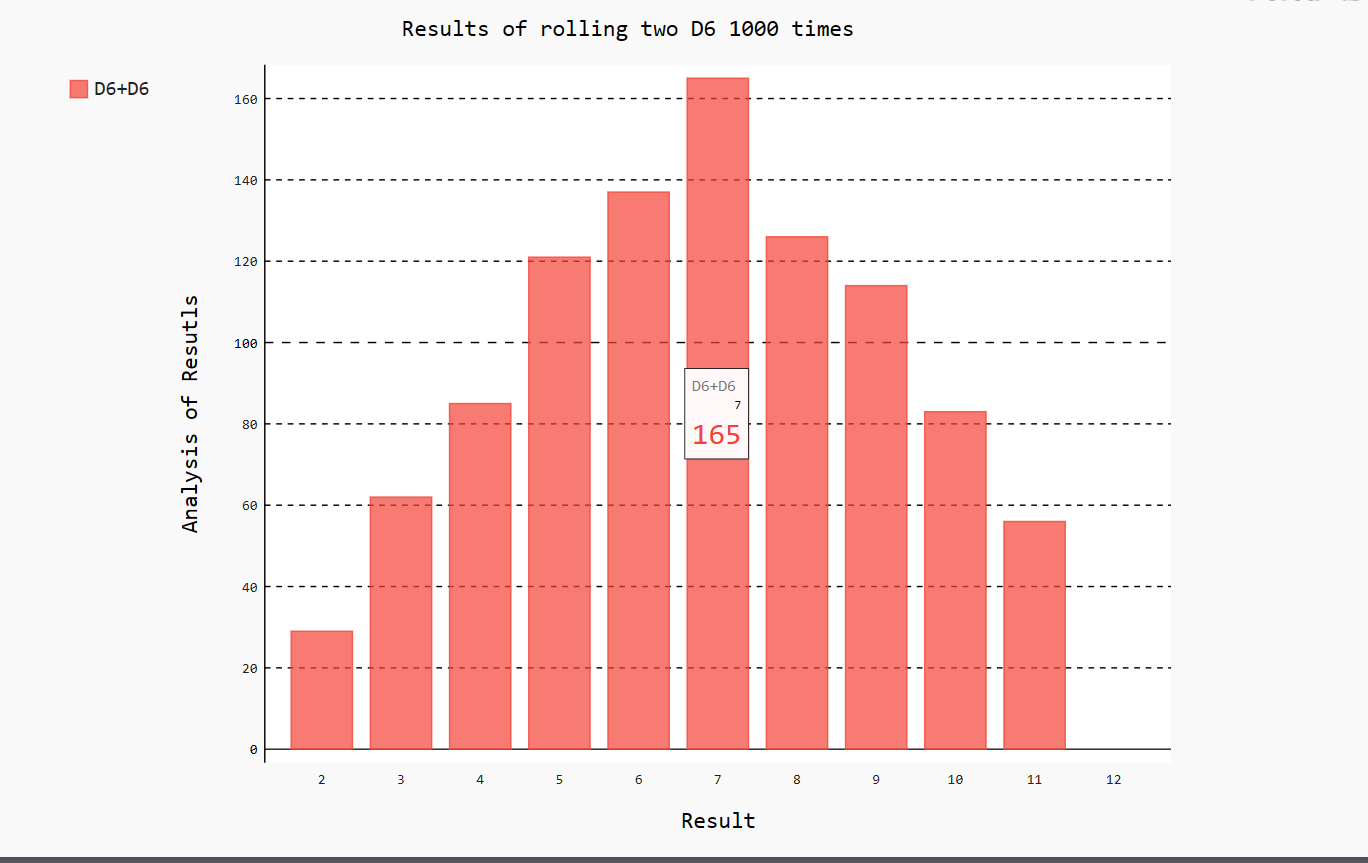
3.3同时掷两个骰子
#!/usr/bin/python3
# -*- encoding: utf-8 -*-
'''
-----------------------------------------------------------------

@文件 :dice_visual.py
@说明 :
@时间 :2023/09/27 21:32:08
@作者 :TanChang

------------------------------------------------------------------
'''


from die import Die
import pygal

"""调用创建两个骰子"""
die_1 = Die()
die_2 = Die()

"""创建列表将多次投骰子的结果加入到列表并输出"""
results = []
for roll_num in range(1000):
    """将掷出来的两个结果相加"""
    result = die_1.roll() + die_2.roll()
    results.append(result)

analysis_result = []
"""按照顺序读取然后计算他们出现的次数"""
for value in range(2,die_1.num_sides+die_2.num_sides+1):
    """使用count来计算出现次数并赋予analysis"""
    analysis = results.count(value)
    analysis_result.append(analysis)

"""创建一个pygal.Bar实列"""
hist = pygal.Bar()

"""设置图主标签和各个值的标签"""
hist.title = "Results of rolling two D6 1000 times"
hist.x_labels = list(range(2,13))
hist.x_title = "Result"
hist.y_title = "Analysis of Resutls"

"""设置数据名"""
hist.add('D6+D6 ',analysis_result)
hist.render_to_file('die_disvual_2.svg')
练习题
15-6:

from die import Die
import pygal

"""调用创建两个骰子"""
die_1 = Die()
die_2 = Die()

"""创建列表将多次投骰子的结果加入到列表并输出"""
results = []
for roll_num in range(1000):
    """将掷出来的两个结果相加"""
    result = die_1.roll() + die_2.roll()
    results.append(result)

analysis_result = []
"""按照顺序读取然后计算他们出现的次数"""
for value in range(2,die_1.num_sides+die_2.num_sides+1):
    """使用count来计算出现次数并赋予analysis"""
    analysis = results.count(value)
    analysis_result.append(analysis)


"""创建一个pygal.Bar实列"""
hist = pygal.Bar()

"""设置图主标签和各个值的标签"""
hist.title = "Results of rolling two D6 1000 times"
hist.x_labels = list(range(min(results),max(results)+1))
hist.x_title = "Result"
hist.y_title = "Analysis of Resutls"

"""设置数据名"""
hist.add('D6+D6 ',analysis_result)
hist.render_to_file('die_disvual_2.svg')
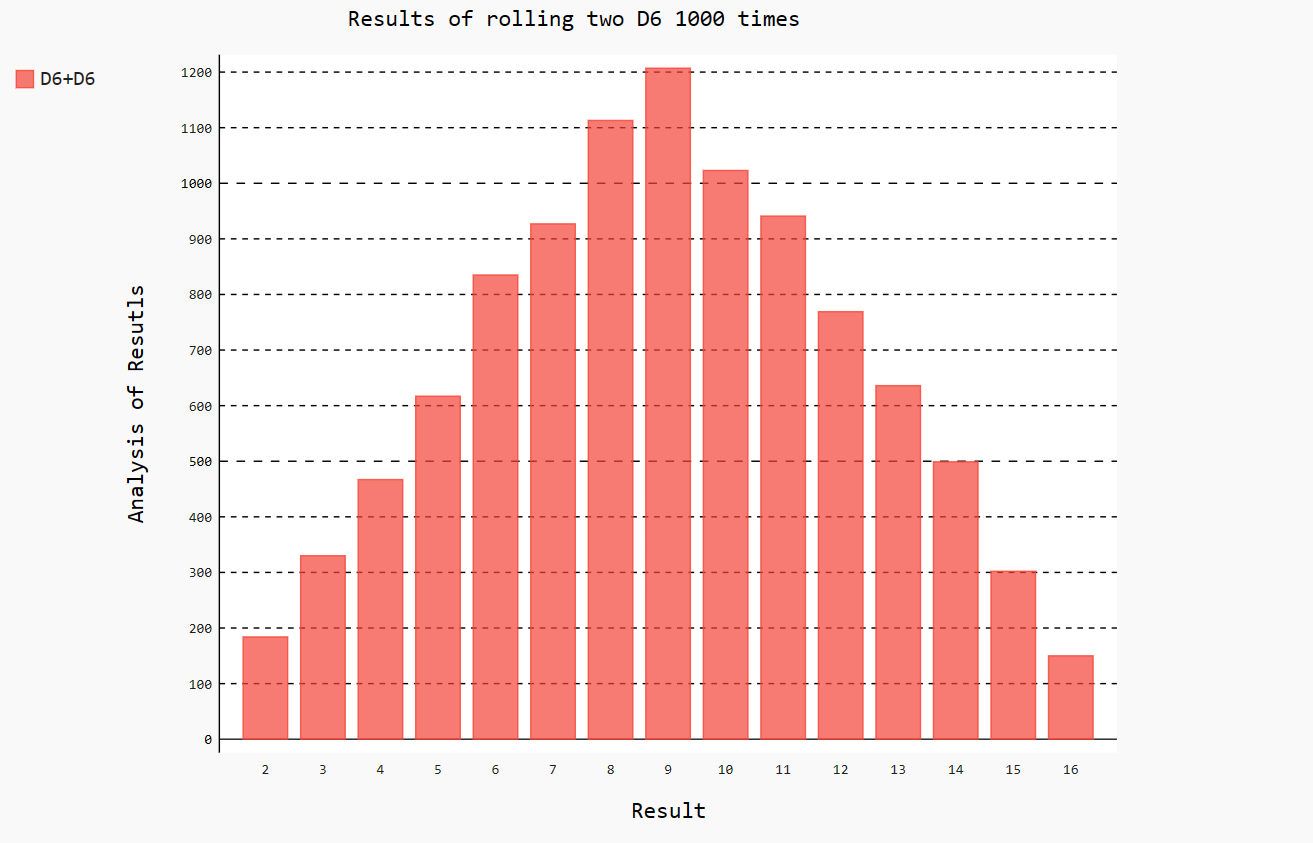
15-7:

from die import Die
import pygal

"""调用创建两个骰子"""
die_1 = Die(8)
die_2 = Die(8)

"""创建列表将多次投骰子的结果加入到列表并输出"""
results = []
for roll_num in range(10000):
    """将掷出来的两个结果相加"""
    result = die_1.roll() + die_2.roll()
    results.append(result)

analysis_result = []
"""按照顺序读取然后计算他们出现的次数"""
for value in range(2,die_1.num_sides+die_2.num_sides+1):
    """使用count来计算出现次数并赋予analysis"""
    analysis = results.count(value)
    analysis_result.append(analysis)


print(max(results))


"""创建一个pygal.Bar实列"""
hist = pygal.Bar()

"""设置图主标签和各个值的标签"""
hist.title = "Results of rolling two D6 1000 times"
# hist.x_labels = list(range(min(results),max(results)+1))
hist.x_labels = list(range(2,17))
hist.x_title = "Result"
hist.y_title = "Analysis of Resutls"

"""设置数据名"""
hist.add('D6+D6 ',analysis_result)
hist.render_to_file('die_disvual_2.svg')
15-10:
https://www.pygal.org/en/stable/documentation/types/dot.html
##还是调用了前面对random_walk

#!/usr/bin/python3
# -*- encoding: utf-8 -*-
'''
-----------------------------------------------------------------

@文件 :pygal_remble.py
@说明 : 使用pygal来模拟随机漫步
@时间 :2023/09/27 22:20:53
@作者 :TanChang

------------------------------------------------------------------
'''
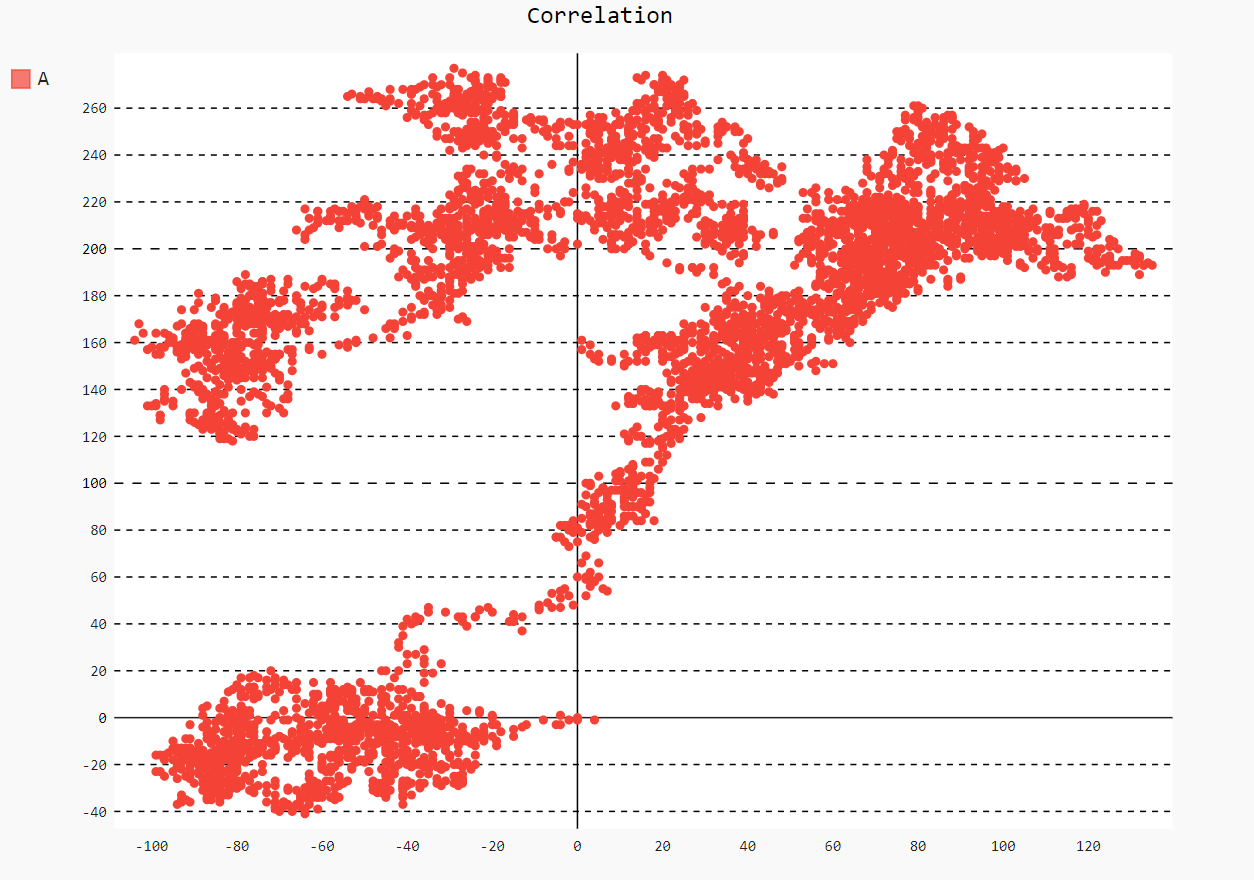
import pygal

from random_walk import RandomWalk

rw = RandomWalk()
rw.fill_walk()

xy_chart = pygal.XY(stroke=False)
xy_chart.title = 'Correlation'
point = []
for i in range(0,rw.num_point):
    point.append((rw.x_value[i],rw.y_value[i]))

xy_chart.add('A',point)
xy_chart.render_to_file('15_10.svg')
4.地区天气
在本节,需要在网上下载数据并,并对这些数据进行可视化。
我们将访问并可视化以两种常见格式存储的数据:CSV和JSON。将用Python的cvs来处理CVS(逗号分隔的值)格式存储的天气数据,找出两个不同地区在一段时间内的最高温度和最低温度,然后使用matplotlib根据下载的数据创建一个图表.....等等
#!/usr/bin/python3
# -*- encoding: utf-8 -*-
'''
-----------------------------------------------------------------

@文件 :highs_lows.py
@说明 :
@时间 :2023/09/29 16:08:14
@作者 :TanChang

------------------------------------------------------------------
'''


import csv

filename = '下载数据/sitka_weather_2021_full.csv'
"""打开CSV文件"""
with open(filename) as f:
    """使用csv.reader()将CSV文件读取并传递给reader"""
    reader = csv.reader(f)
    """使用next()调用文件,但是只会调用一行"""
    header_row = next(reader)
    print(header_row)
结果:
['STATION', 'NAME', 'DATE', 'AWND', 'PGTM', 'PRCP', 'TAVG', 'TMAX', 'TMIN', 'WDF2', 'WDF5', 'WSF2', 'WSF5', 'WT01', 'WT02', 'WT04', 'WT05', 'WT08', 'WT09']
4.2打印问及那头及其位置
使用enumerate来读取元素的索引和值,为了方便后面直接取值的时候调用索引就好了
import csv

filename = '下载数据/sitka_weather_2021_full.csv'
"""打开CSV文件"""
with open(filename) as f:
    """使用csv.reader()将CSV文件读取并传递给reader"""
    reader = csv.reader(f)
    """使用next()调用文件,但是只会调用一行"""
    header_row = next(reader)
    """enumerate()用来获取每个元素的索引和值"""
    for index,column_header in enumerate(header_row):
        print(index,column_header)
0 STATION
1 NAME
2 DATE
3 AWND
4 PGTM
5 PRCP
6 TAVG
7 TMAX
8 TMIN
9 WDF2
10 WDF5
11 WSF2
12 WSF5
13 WT01
14 WT02
15 WT04
16 WT05
17 WT08
18 WT09
4.3提取数据
从文件中提取最高气温,从上个索引可见最高温度的索引为7
    """创建一个空列表"""
    highs = []
    """读取列表中"""
    for row in reader:
        """"""
        high = int(row[7])
        """读取最高温度"""
        highs.append(high)
    print(highs)
['44', '44', '43', '45', '45', '44', '48', '48', '46', '46', '44', '44', '39', '47', '48', '47', '46', '48', '42', '38', '41', '40', '38', '39', '37', '36', '30', '36', '40', '42', '43', '38', '38', '40', '39', '37', '37', '36', '30', '17', '30', '37', '39', '38', '37', '35', '38', '43', '43', '42', '44', '44', '42', '38', '39', '42', '43', '44', '45', '41', '41', '41', '43', '43', '43', '47', '40', '41', '40', '41', '37', '35', '34', '40', '42', '43', '40', '37', '39', '43', '42', '42', '40', '41', '42', '39', '41', '41', '41', '41', '36', '38', '41', '41', '40', '38', '41', '39', '39', '36', '41', '41', '45', '45', '48', '50', '56', '67', '61', '51', '57', '52', '', '63', '60', '53', '50', '51', '48', '47', '48', '50', '49', '48', '55', '63', '56', '50', '49', '52', '49', '49', '47', '49', '48', '49', '52', '56', '57', '52', '53', '49', '53', '50', '51', '51', '51', '49', '57', '58', '58', '56', '53', '51', '56', '58', '54', '58', '59', '53', '55', '59', '61', '67', '64', '58', '60', '66', '58', '68', '59', '55', '56', '63', '63', '59', '63', '78', '75', '61', '62', '61', '60', '66', '60', '65', '59', '58', '58', '57', '60', '60', '60', '57', '58', '60', '61', '63', '63', '70', '64', '59', '63', '61', '58', '59', '64', '62', '70', '70', '73', '66', '66', '62', '67', '65', '69', '63', '65', '63', '60', '60', '61', '65', '64', '60', '58', '64', '58', '59', '63', '61', '63', '68', '61', '59', '60', '63', '60', '60', '60', '65', '64', '61', '63', '60', '60', '59', '61', '64', '60', '61', '62', '58', '58', '58', '55', '55', '55', '56', '55', '57', '58', '57', '54', '60', '57', '53', '58', '51', '55', '55', '53', '53', '52', '48', '51', '52', '51', '52', '51', '51', '52', '48', '51', '50', '49', '49', '48', '48', '52', '55', '56', '56', '55', '51', '51', '49', '52', '47', '44', '44', '49', '54', '59', '55', '48', '46', '50', '48', '47', '46', '45', '44', '47', '47', '41', '42', '39', '46', '45', '42', '36', '46', '47', '42', '40', '46', '48', '39', '39', '37', '40', '44', '43', '38', '33', '33', '37', '37', '43', '40', '40', '42', '36', '37', '35', '32', '35', '36', '39', '38', '39', '37', '39', '38', '32', '30', '26', '31', '35', '35', '41', '38', '39']
4.4绘制气温图表
上面加入到列表的不是int型而是str型,所以我们如果想要绘图,就需要将数据类型转换为int
    """创建一个空列表"""
    highs = []
    """读取列表中"""
    for row in reader:
        """判断是否为空数据"""
        if row[7] != '':
            """装换为整形"""
            high = int(row[7])
            """读取最高温度"""
            highs.append(high)
    print(highs)
[44, 44, 43, 45, 45, 44, 48, 48, 46, 46, 44, 44, 39, 47, 48, 47, 46, 48, 42, 38, 41, 40, 38, 39, 37, 36, 30, 36, 40, 42, 43, 38, 38, 40, 39, 37, 37, 36, 30, 17, 30, 37, 39, 38, 37, 35, 38, 43, 43, 42, 44, 44, 42, 38, 39, 42, 43, 44, 45, 41, 41, 41, 43, 43, 43, 47, 40, 41, 40, 41, 37, 35, 34, 40, 42, 43, 40, 37, 39, 43, 42, 42, 40, 41, 42, 39, 41, 41, 41, 41, 36, 38, 41, 41, 40, 38, 41, 39, 39, 36, 41, 41, 45, 45, 48, 50, 56, 67, 61, 51, 57, 52, 63, 60, 53, 50, 51, 48, 47, 48, 50, 49, 48, 55, 63, 56, 50, 49, 52, 49, 49, 47, 49, 48, 49, 52, 56, 57, 52, 53, 49, 53, 50, 51, 51, 51, 49, 57, 58, 58, 56, 53, 51, 56, 58, 54, 58, 59, 53, 55, 59, 61, 67, 64, 58, 60, 66, 58, 68, 59, 55, 56, 63, 63, 59, 63, 78, 75, 61, 62, 61, 60, 66, 60, 65, 59, 58, 58, 57, 60, 60, 60, 57, 58, 60, 61, 63, 63, 70, 64, 59, 63, 61, 58, 59, 64, 62, 70, 70, 73, 66, 66, 62, 67, 65, 69, 63, 65, 63, 60, 60, 61, 65, 64, 60, 58, 64, 58, 59, 63, 61, 63, 68, 61, 59, 60, 63, 60, 60, 60, 65, 64, 61, 63, 60, 60, 59, 61, 64, 60, 61, 62, 58, 58, 58, 55, 55, 55, 56, 55, 57, 58, 57, 54, 60, 57, 53, 58, 51, 55, 55, 53, 53, 52, 48, 51, 52, 51, 52, 51, 51, 52, 48, 51, 50, 49, 49, 48, 48, 52, 55, 56, 56, 55, 51, 51, 49, 52, 47, 44, 44, 49, 54, 59, 55, 48, 46, 50, 48, 47, 46, 45, 44, 47, 47, 41, 42, 39, 46, 45, 42, 36, 46, 47, 42, 40, 46, 48, 39, 39, 37, 40, 44, 43, 38, 33, 33, 37, 37, 43, 40, 40, 42, 36, 37, 35, 32, 35, 36, 39, 38, 39, 37, 39, 38, 32, 30, 26, 31, 35, 35, 41, 38, 39]
将数据导入到matplotlib中去
from matplotlib import pyplot as plt
.....

fig = plt.figure(dpi = 128,figsize=(10,6))
plt.plot(highs,c='red')
plt.title("Weather temperature",fontsize = 24)
plt.xlabel('',fontsize=16)
plt.ylabel('temperature(F)',fontsize=16)
"""with表示刻度线的宽度"""
plt.tick_params(axis='both',which='major',labelsize=16)

plt.show()
4.4使用datetime模块来导入时间
我们的CSV文件中有时间数据文件,那么我们可以使用datetime模块来按照规定的格式来导出天气数据,datetime的strpitme方法则用%Y、%m、%d等
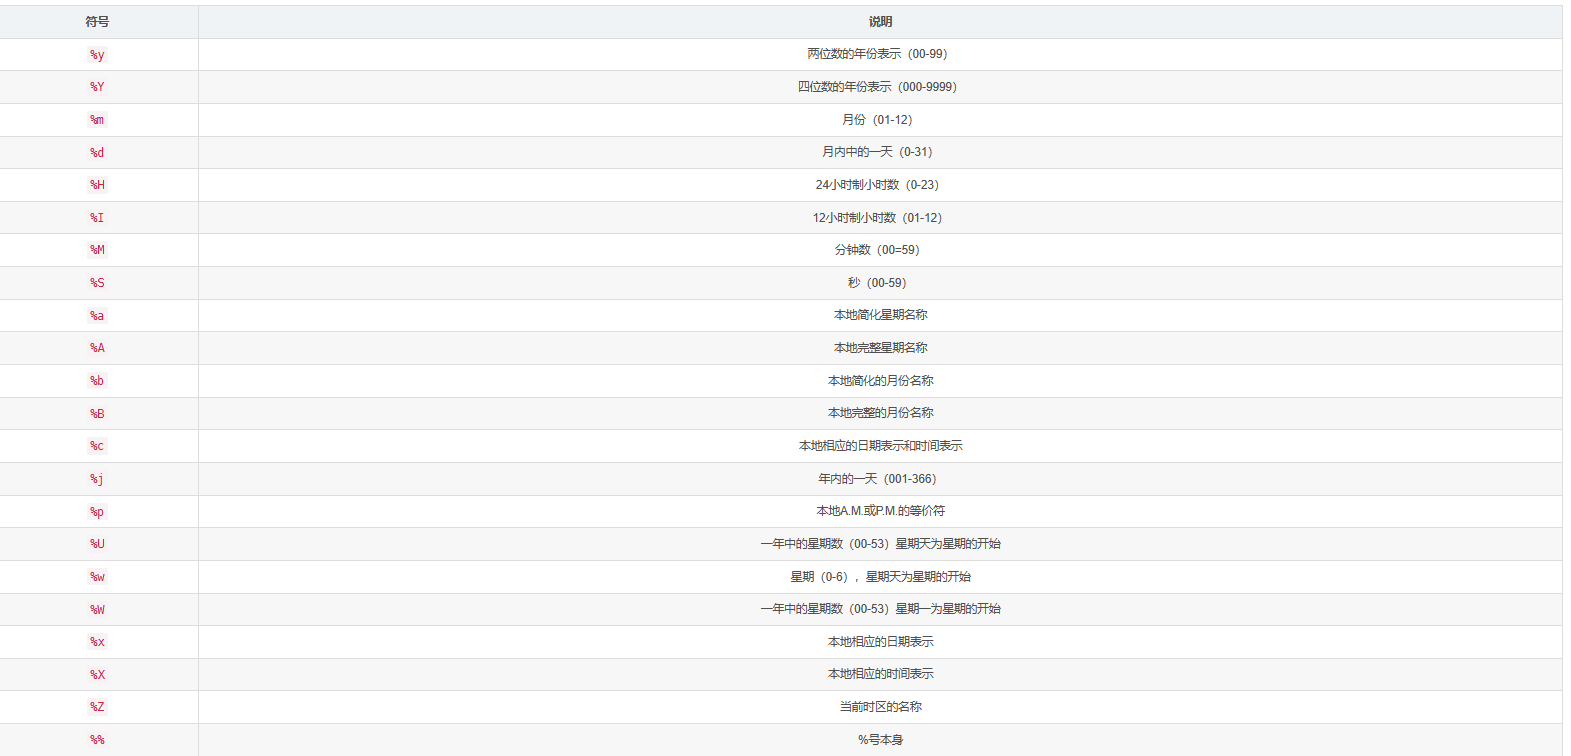
这节换成了simple数据而不是full数据
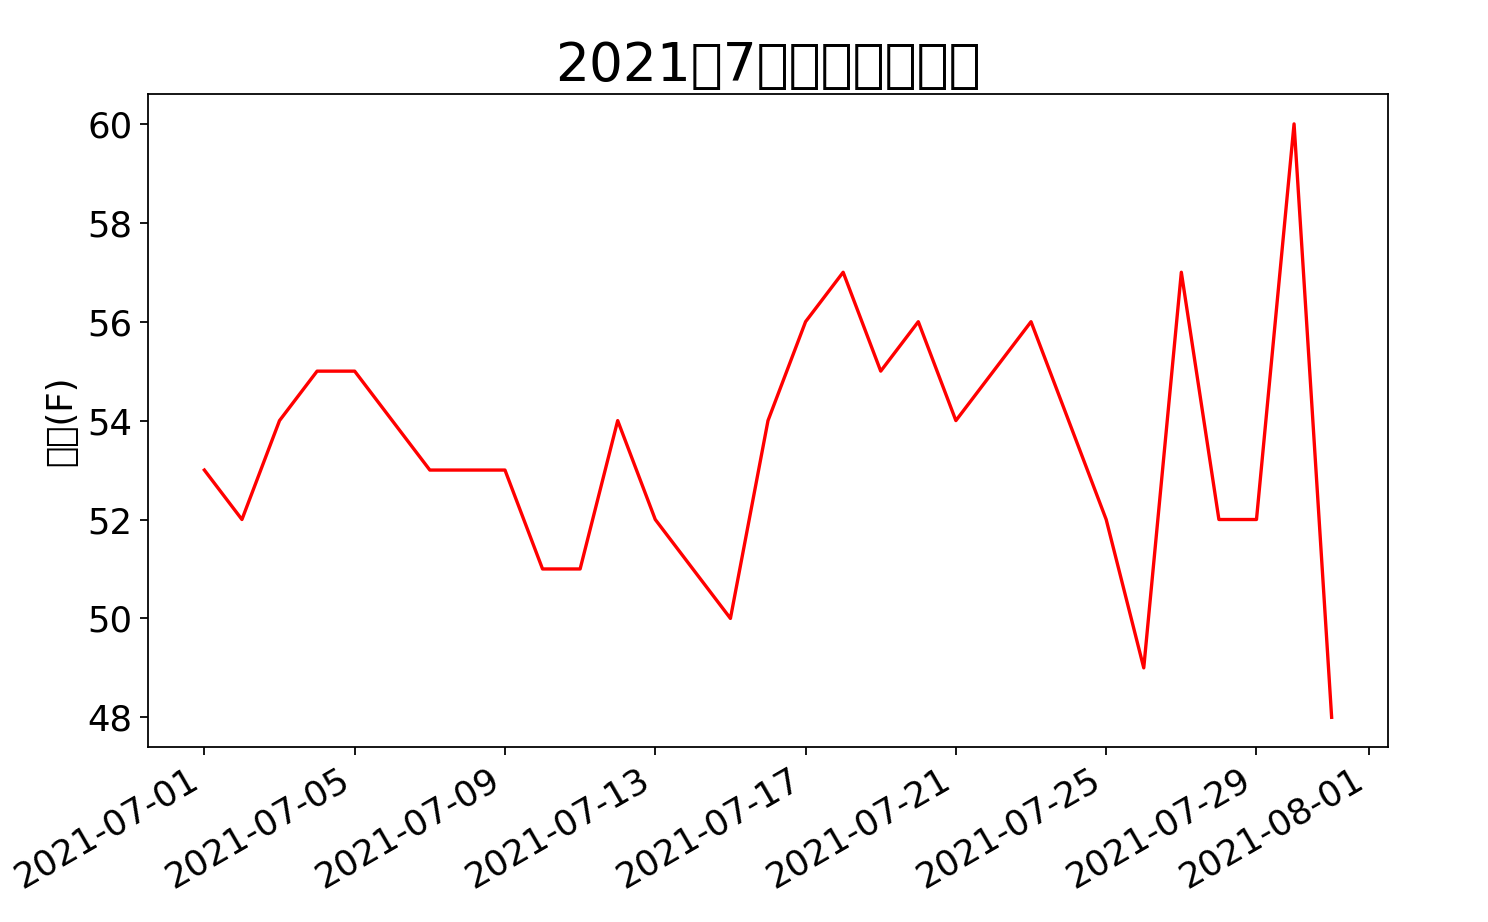
from matplotlib import pyplot as plt
import csv
from datetime import datetime

filename = "下载数据/sitka_weather_07-2021_simple.csv"

"""打开CSV文件"""
with open(filename) as f:
    """使用csv.reader()将CSV文件读取并传递给reader"""
    reader = csv.reader(f)
    """使用next()调用文件,但是只会调用一行"""
    header_row = next(reader)
    """enumerate()用来获取每个元素的索引和值"""
    # for index,column_header in enumerate(header_row):
    #     print(index,column_header)

    """创建两个个空列表,前者为当天时间,后者为最高温度"""
    date,highs = [],[]
    """读取列表中"""
    for row in reader:
        """使用datatime的strptime方法%Y-%m-%d表示年-月-日,将数据赋予变量"""
        current_date = datetime.strptime(row[2], '%Y-%m-%d')
        """在将加入到列表中"""
        date.append(current_date)
        if row[5] != '':
            """装换为整形"""
            high = int(row[5])
            """读取最高温度"""
            highs.append(high)


fig= plt.figure(dpi = 128,figsize=(10,6))
plt.plot(date,highs,c='red')
plt.set_title("2021年7月每日最高温度",fontsize = 24)
plt.xlabel('',fontsize=16)
"""绘制倾斜的日期标签,以免日期重叠"""
fig.autofmt_xdate()
plt.ylabel('温度(F)',fontsize=16)
"""with表示刻度线的宽度"""
plt.tick_params(axis='both',which='major',labelsize=16)

plt.show()
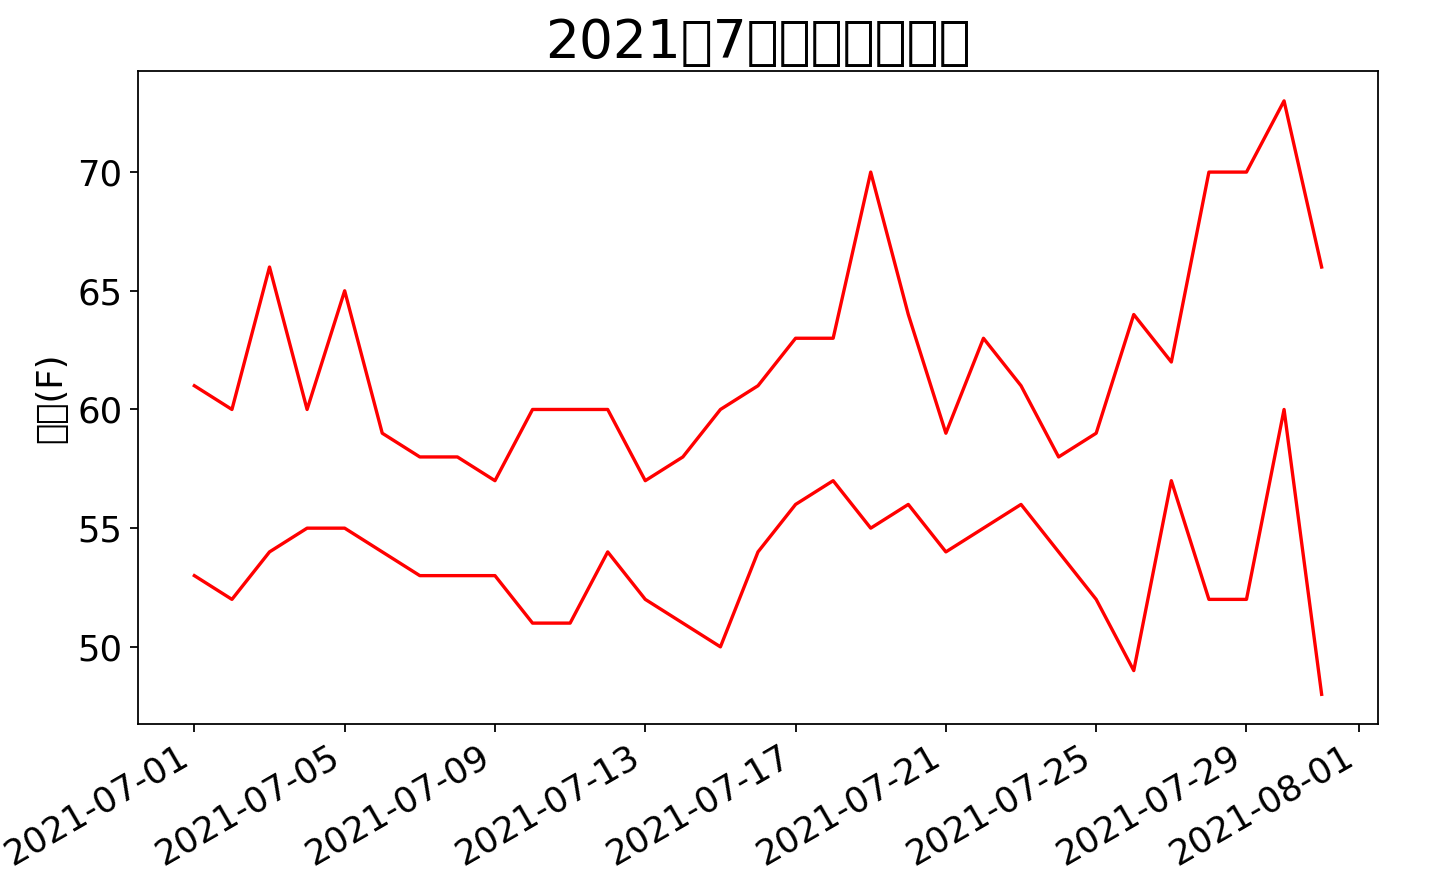
4.5绘制最低温度的图表
    """创建两个个空列表,前者为当天最低温度,中为时间,后者为最高温度"""
    lows,date,highs = [],[],[]
    """读取列表中"""
    for row in reader:
		.......
        """将最低温度数据加入到列表中"""
        if row[5] != '':
            low = int(row[5])
            lows.append(low)
		.........

fig= plt.figure(dpi = 128,figsize=(10,6))
"""最高温度图表"""
plt.plot(date,highs,c='red')
"""最低温度图表"""
plt.plot(date,lows,c='red')
........
plt.show()
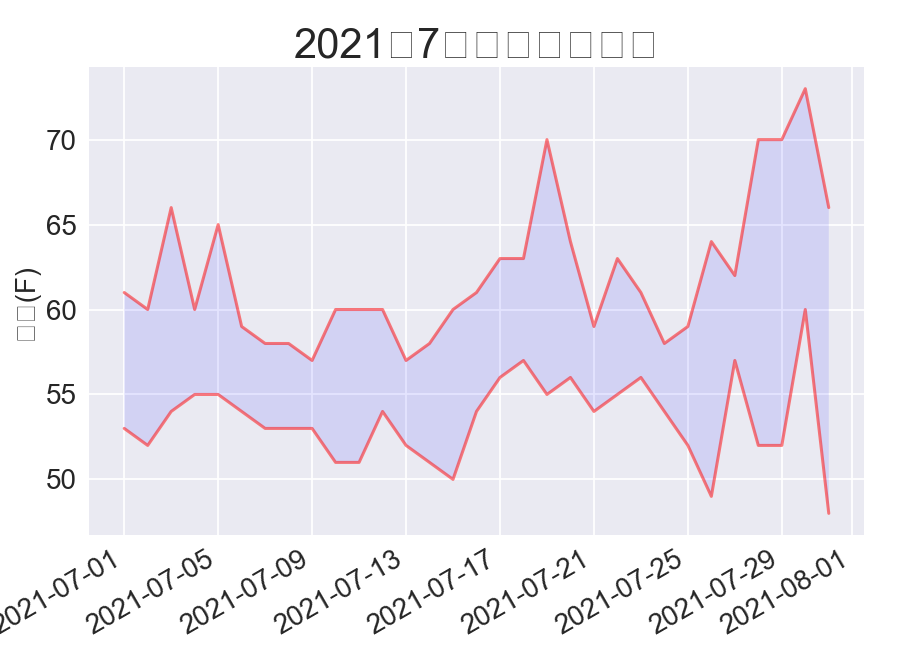
4.6给图表区域着色
plt.style.use('seaborn')
fig,ax = plt.subplots()
"""绘画最小和最高,alpha设置颜色透明度,0表示完全透明,1为默认不透明"""
ax.plot(dates,highs,c='red',alpha=0.5)
ax.plot(dates,lows,c='red',alpha=0.5)
"""fill_between传递一个x值dates,y系列highs和lows,指定facecolor区域的颜色"""
ax.fill_between(dates,highs,lows,facecolor='blue',alpha=0.1)
ax.set_title("2021年7月每日最高温度",fontsize=24)
fig.autofmt_xdate()
ax.set_ylabel("温度(F)",fontsize=16)
ax.tick_params(axis='both',which='major',labelsize=16)

plt.show()
练习16-1
import csv

import matplotlib.pyplot as plt
from datetime import datetime

file_sitka = '下载数据/sitka_weather_2021_full.csv'
file_death='下载数据/death_valley_2021_full.csv'

with open(file_sitka) as f:
    reader = csv.reader(f)
    reader_row = next(reader)
    # for index,header_row in enumerate(reader_row):
    #     print(index,header_row)
    dates,sitka_prcps,death_prcps = [],[],[]
    for row in reader:
        date = datetime.strptime(row[2],"%Y-%m-%d")
        prcps = float(row[5])
        dates.append(date)
        sitka_prcps.append(prcps)
    with open(file_death) as f2:
        reader_tow = csv.reader(f2)
        reader_row_tow = next(reader_tow)
        for row_tow in reader_tow:
            prcps_tow = float(row_tow[3])
            death_prcps.append(prcps_tow)


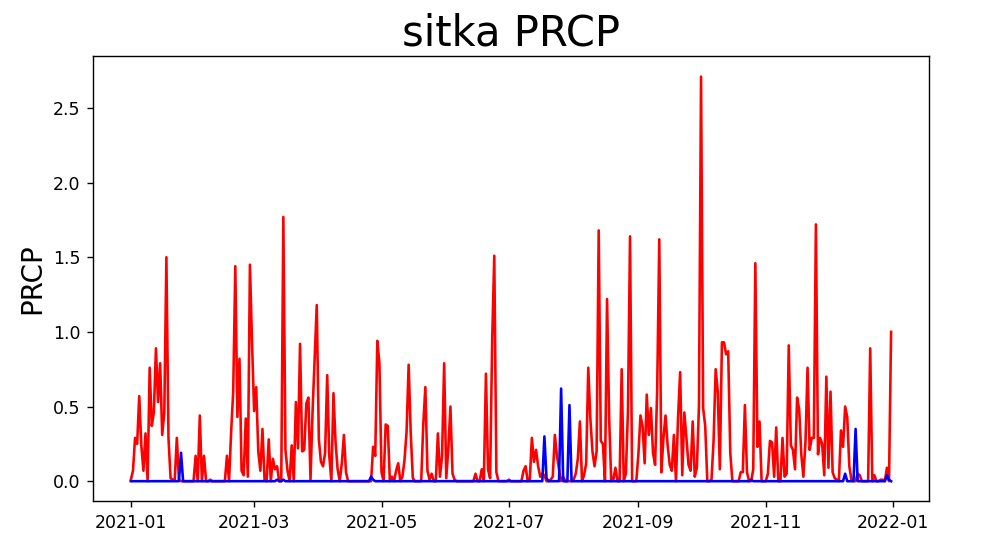
"""这里我使用的是subplots它是即创建了一个子图区域的画布,又创建了一个figure图像对象,它还有一个subplot()只创建子图区域"""
fig,ax = plt.subplots()
ax.plot(dates,sitka_prcps,c='red')
ax.plot(dates,death_prcps,c='b')
ax.set_title("sitka PRCP",fontsize='24')
ax.set_ylabel("PRCP",fontsize='16')
ax.tick_params(axis='both',which='major',labelsize=10)

plt.show()
练习16-2限制x轴参数,对比两个地区的最高、最低温度
#!/usr/bin/python3
# -*- encoding: utf-8 -*-
'''
-----------------------------------------------------------------

@文件 :16-2.py
@说明 :
@时间 :2023/10/09 23:30:13
@作者 :TanChang

------------------------------------------------------------------
'''


import csv

import matplotlib.pyplot as plt
from datetime import datetime

file_sitka = '下载数据/sitka_weather_2021_full.csv'
file_death='下载数据/death_valley_2021_full.csv'
def get_num(filename,date,prcp,high,low,prcps,dates,highs,lows):
    with open(filename) as f:
        reader = csv.reader(f)
        reader_row = next(reader)
        # for index,header_row in enumerate(reader_row):
        #     print(index,header_row)

        for row in reader:
            try:
                date_num = datetime.strptime(row[date],"%Y-%m-%d")
                high_num = int(row[high])
                low_num = int(row[low])
                prcp_num = float(row[prcp])
            except ValueError:
                print(f"Miss data for {date_num}")
            else:
                dates.append(date_num)
                highs.append(high_num)
                lows.append(low_num)
                prcps.append(prcp_num)


sit_dates,sit_prcps,sit_highs,sit_lows = [],[],[],[]
get_num(file_sitka,2,5,7,8,sit_prcps,sit_dates,sit_highs,sit_lows)
fig,ax= plt.subplots()
ax.plot(sit_dates,sit_highs,c='r')
ax.plot(sit_dates,sit_lows,c='r')
ax.fill_between(sit_dates,sit_highs,sit_lows,facecolor='red',alpha=0.1)


dea_dates,dea_prcps,dea_highs,dea_lows = [],[],[],[]
get_num(file_death,2,3,6,7,dea_prcps,dea_dates,dea_highs,dea_lows)
ax.plot(dea_dates,dea_highs,c='b')
ax.plot(dea_dates,dea_lows,c='b')
ax.fill_between(dea_dates,dea_highs,dea_lows,facecolor='blue',alpha=0.1)


fig.autofmt_xdate()
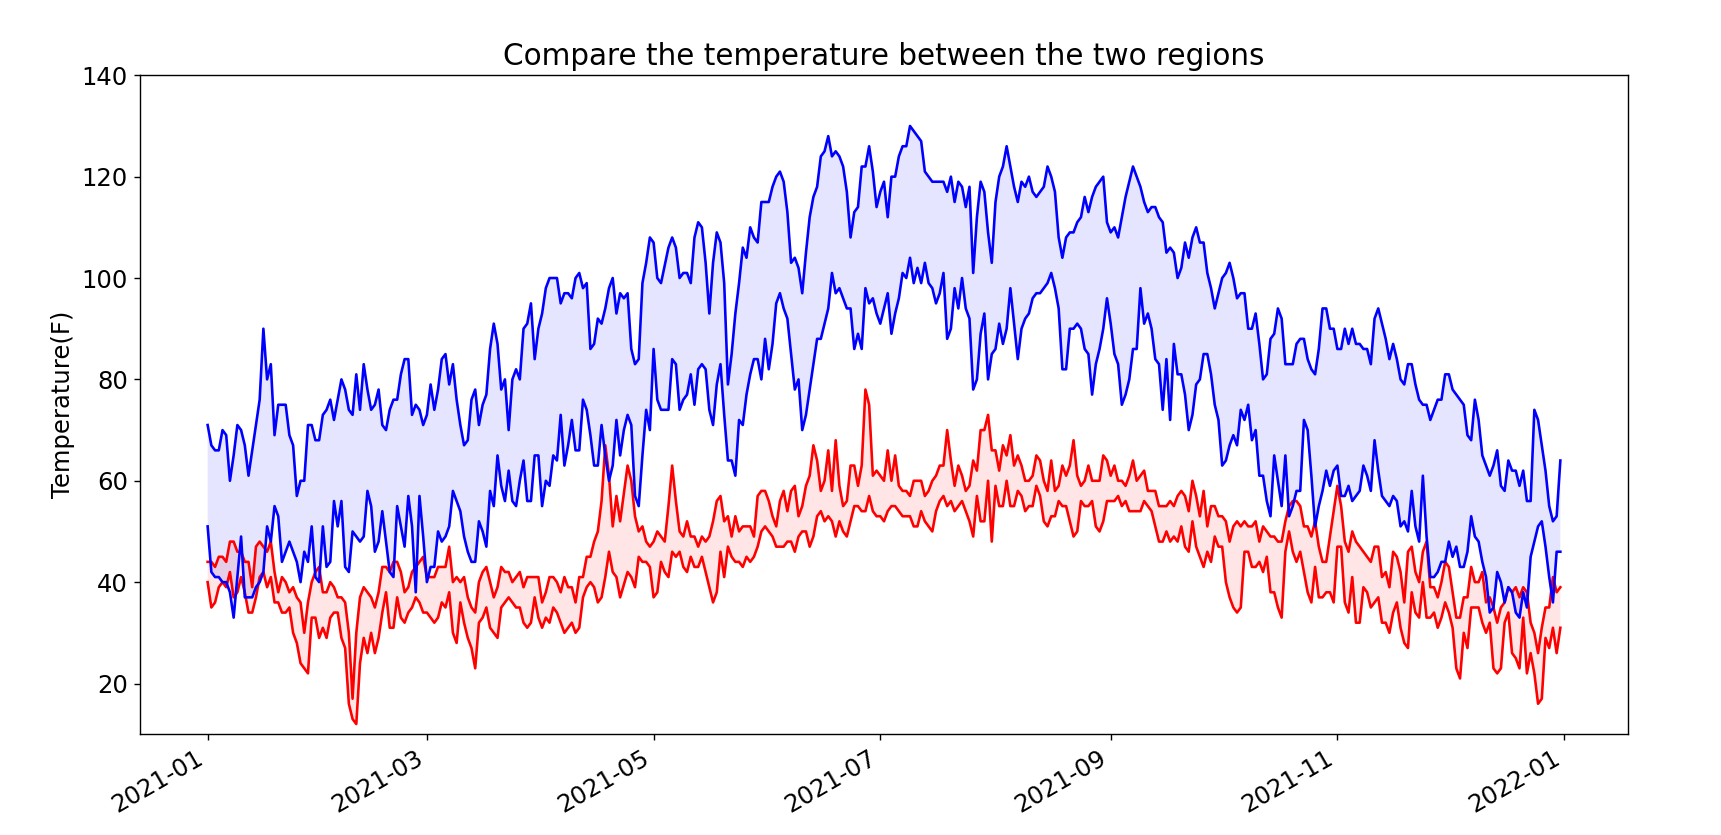
ax.set_title("Compare the temperature between the two regions",fontsize=17)
ax.set_ylabel("Temperature(F)",fontsize=14)
ax.tick_params(axis='both',which='major',labelsize=14)
"""plt.ylim()用于限制x轴的范围"""
plt.ylim(10, 140)
plt.show()
16-4使用自带索引简化以上代码
#!/usr/bin/python3
# -*- encoding: utf-8 -*-
'''
-----------------------------------------------------------------

@文件 :16-4.py
@说明 :
@时间 :2023/10/10 19:48:46
@作者 :TanChang

------------------------------------------------------------------
'''

import csv

import matplotlib.pyplot as plt
from datetime import datetime

file_sitka = '下载数据/sitka_weather_2021_full.csv'
file_death='下载数据/death_valley_2021_full.csv'
def get_num(filename,prcps,dates,highs,lows):
    with open(filename) as f:
        reader = csv.reader(f)
        reader_row = next(reader)
        """直接使用index代码"""
        date = reader_row.index('DATE')
        high = reader_row.index('TMAX')
        low = reader_row.index('TMIN')
        prcp = reader_row.index('PRCP')
        # for index,header_row in enumerate(reader_row):
        #     print(index,header_row)

        for row in reader:
            try:
                date_num = datetime.strptime(row[date],"%Y-%m-%d")
                high_num = int(row[high])
                low_num = int(row[low])
                prcp_num = float(row[prcp])
            except ValueError:
                print(f"Miss data for {date_num}")
            else:
                dates.append(date_num)
                highs.append(high_num)
                lows.append(low_num)
                prcps.append(prcp_num)


sit_dates,sit_prcps,sit_highs,sit_lows = [],[],[],[]
get_num(file_sitka,sit_prcps,sit_dates,sit_highs,sit_lows)
fig,ax= plt.subplots()
ax.plot(sit_dates,sit_highs,c='r')
ax.plot(sit_dates,sit_lows,c='r')
ax.fill_between(sit_dates,sit_highs,sit_lows,facecolor='red',alpha=0.1)


dea_dates,dea_prcps,dea_highs,dea_lows = [],[],[],[]
get_num(file_death,dea_prcps,dea_dates,dea_highs,dea_lows)
ax.plot(dea_dates,dea_highs,c='b')
ax.plot(dea_dates,dea_lows,c='b')
ax.fill_between(dea_dates,dea_highs,dea_lows,facecolor='blue',alpha=0.1)


fig.autofmt_xdate()
ax.set_title("Compare the temperature between the two regions",fontsize=17)
ax.set_ylabel("Temperature(F)",fontsize=14)
ax.tick_params(axis='both',which='major',labelsize=14)
"""plt.ylim()用于限制x轴的范围"""
plt.ylim(10, 140)
plt.show()
是
5.使用json数据制作全球地震散点图
会下载一个数据集,其中记录了一个月内全球发生的所有地震,在制作一副散点图来展示这些地址的位置和震级别,这些数据是用json格式存储的,因此需要使用到json模块来处理;
5.1查看json数据,
将 eq_data_1_day_m1.json文件添加到你所要编辑带文件夹内打开,可以查看到,如果我们现在直观的看这些数据是很难看懂的

我们可以使用json模块让我们更加清晰的看
#!/usr/bin/python3
# -*- encoding: utf-8 -*-
'''
-----------------------------------------------------------------

@文件 :eq_explore_data.py
@说明 :
@时间 :2023/10/10 20:18:14
@作者 :TanChang

------------------------------------------------------------------
'''
import json

filename = "地震图/data/eq_data_1_day_m1.json"

"""打开初始json文件"""
with open(filename) as f:
    """json.load()将函数数据转换位Python可以处理的格式,相当于字典"""
    all_eq_data = json.load(f)

"""创建转换后格式写入的文件,需要自行创建"""
readable_file = "地震图/data/readable_eq_data.json"
with open(readable_file,'w') as rf:
    """json.dump可以接受一个数据对象和一个文件对象,并且将数据写入,indent是缩减量"""
    json.dump(all_eq_data,rf,indent=4)
查看转换后的文件格式

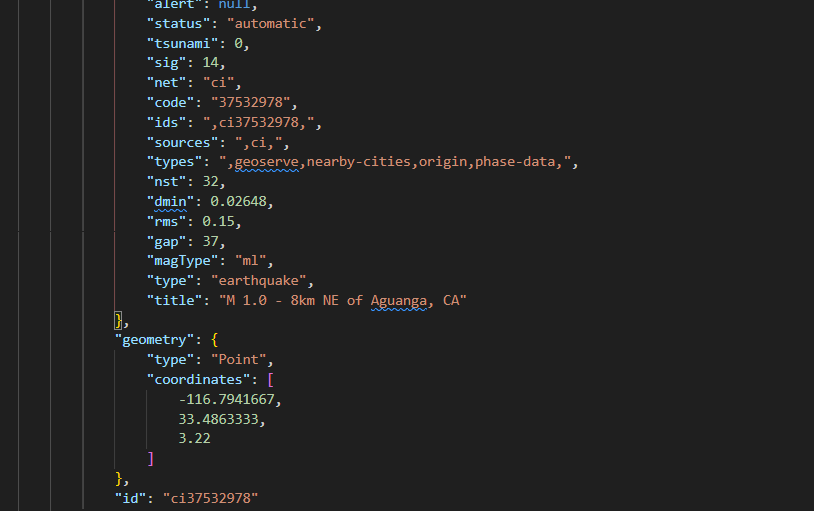
1.其中matedata表示了这个数据文件是什么时候生成的,已经在什么地方可以找到,和保护了在过去的24小时中发生了158次地震
2.features中保存了地震的数据
3.properties关连到了与特定地震相关的大量信息
4.title描述了地震位 mag描述了地震的震级
5.geometry指出了地震的详细坐标地址
6.coordinates中1,2位经纬坐标
5.2创建地震列表
创建一个地震列表,包含所有地震的各个信息
import json

filename = "地震图/data/eq_data_1_day_m1.json"

"""打开初始json文件"""
with open(filename) as f:
    """json.load()将函数数据转换位Python可以处理的格式,相当于字典"""
    all_eq_data = json.load(f)

"""直接读取feature的值因为它存储了文次数据中所有地震的信息"""
all_eq_dicts = all_eq_data['features']
"""输出可以查看到有158"""
print(len(all_eq_dicts))
5.3提取地震的等级
直接遍历以上创建的列表即可
"""直接读取feature的值因为它存储了文次数据中所有地震的信息"""
all_eq_dicts = all_eq_data['features']

"""创建一个空列表,将遍历到的震级数据导入"""
mags = []
for i in all_eq_dicts:
    mags.append(i['properties']['mag'])

print(mags[:10])
结果:
[0.96, 1.2, 4.3, 3.6, 2.1, 4, 1.06, 2.3, 4.9, 1.8]
5.4提取地震的地址数据
还是一样再次遍历那个表
"""直接读取feature的值因为它存储了文次数据中所有地震的信息"""
all_eq_dicts = all_eq_data['features']
# """输出可以查看到有158"""
# print(len(all_eq_dicts))

"""创建一个空列表,将遍历到的震级数据导入,在创建地址和经纬度列表提取地址数据"""
mags,titles,lons,lats= [],[],[],[]
for i in all_eq_dicts:
    mag = i['properties']['mag']
    title = i['properties']['title']
    lon = i['geometry']['coordinates'][0]
    lat = i['geometry']['coordinates'][1]
    mags.append(mag)
    titles.append(title)
    lons.append(lon)
    lats.append(lat)

print(mags[:10])
print(titles[:3])
print(lons[:5])
print(lats[:5])
[0.96, 1.2, 4.3, 3.6, 2.1, 4, 1.06, 2.3, 4.9, 1.8]
['M 1.0 - 8km NE of Aguanga, CA', 'M 1.2 - 11km NNE of North Nenana, Alaska', 'M 4.3 - 69km NNW of Ayna, Peru']
[-116.7941667, -148.9865, -74.2343, -161.6801, -118.5316667]
[33.4863333, 64.6673, -12.1025, 54.2232, 35.3098333]
5.5绘制震级散点图
"""plotly_express是plotly的高级封装,入手简单,它对plotly的常用绘图函数进行了封装,调用简单,缺点是没有plotly那样自由"""
import plotly.express as px
import json

filename = "地震图/data/eq_data_1_day_m1.json"

"""打开初始json文件"""
with open(filename) as f:
    """json.load()将函数数据转换位Python可以处理的格式,相当于字典"""
    all_eq_data = json.load(f)

"""直接读取feature的值因为它存储了文次数据中所有地震的信息"""
all_eq_dicts = all_eq_data['features']


"""创建一个空列表,将遍历到的震级数据导入,在创建地址和经纬度列表提取地址数据"""
mags,titles,lons,lats= [],[],[],[]
for i in all_eq_dicts:
    mag = i['properties']['mag']
    title = i['properties']['title']
    lon = i['geometry']['coordinates'][0]
    lat = i['geometry']['coordinates'][1]
    mags.append(mag)
    titles.append(title)
    lons.append(lon)
    lats.append(lat)

fig = px.scatter(
    x=lons,
    y=lats,
    labels={"x":"经度","y":"纬度"},
    range_x = [-200,200],
    range_y=[-90,90],
    width=800,
    height=800,
    title="全球地震散图",
)

fig.write_html("地震图/data/global_earthquakes.html")
fig.show()
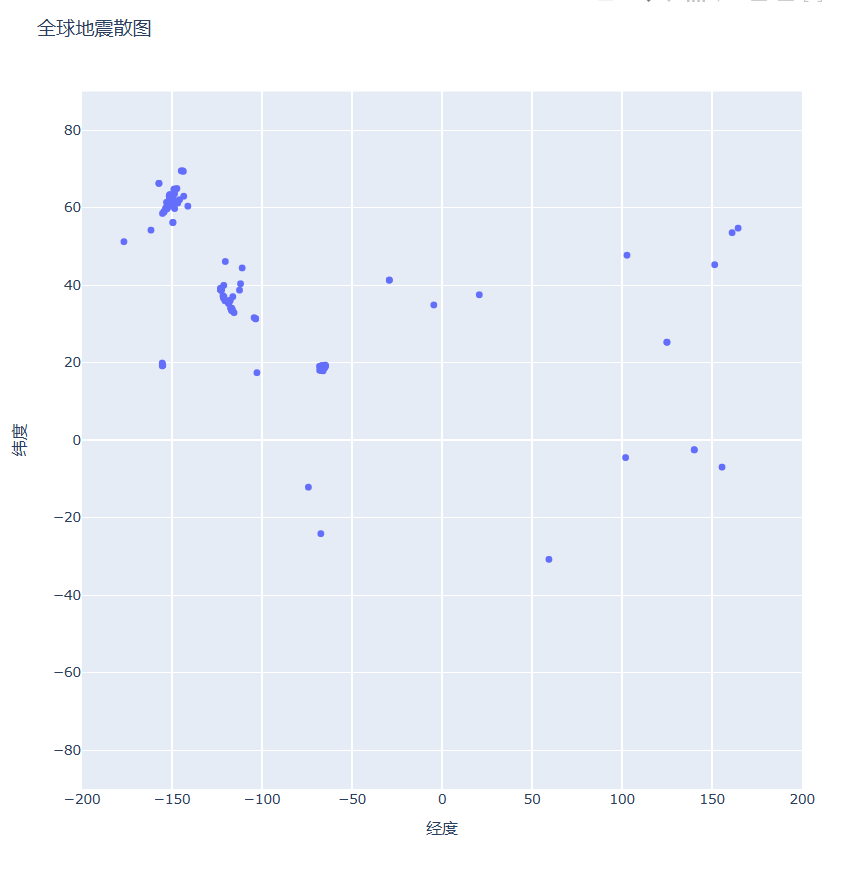
此外我们还可以优化一下代码
"""
使用pandas的DataFrame将数据封装起来
columns对应提供数据的列标签
zip()函数将提供的列表数组用元组封装起来
此外还提供dtype为数据类型
"""
data = pd.DataFrame(data=zip(lons,lats,titles,mags),columns = ["经度","纬度","位置"])
data.head()

fig = px.scatter(
    data,
    x="经度",
    y="纬度",
    labels={"x":"经度","y":"纬度"},
    range_x = [-200,200],
    range_y=[-90,90],
    width=800,
    height=800,
    title="全球地震散图",
)

fig.write_html("地震图/data/global_earthquakes.html")
fig.show()
5.6定制标记的尺寸
fig = px.scatter(
    data,
    x="经度",
    y="纬度",
    labels={"x":"经度","y":"纬度"},
    range_x = [-200,200],
    range_y=[-90,90],
    width=800,
    height=800,
    title="全球地震散图",
    size='震级',
    size_max = 10
)

fig.write_html("地震图/data/global_earthquakes.html")
fig.show()
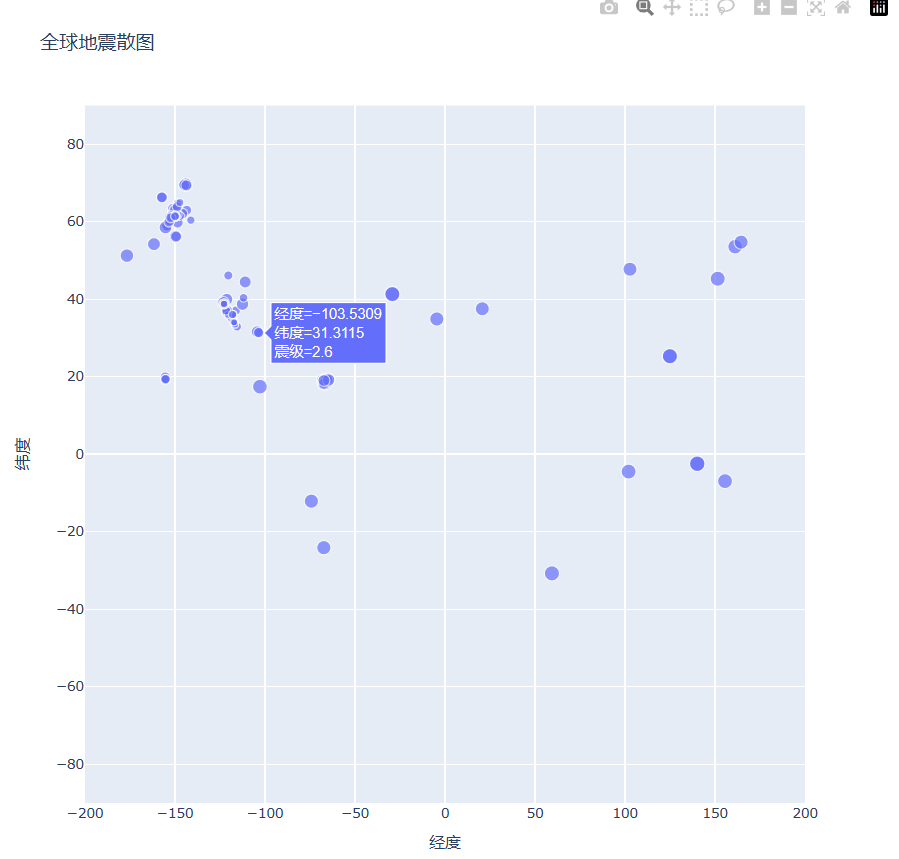
5.7定制标记的颜色
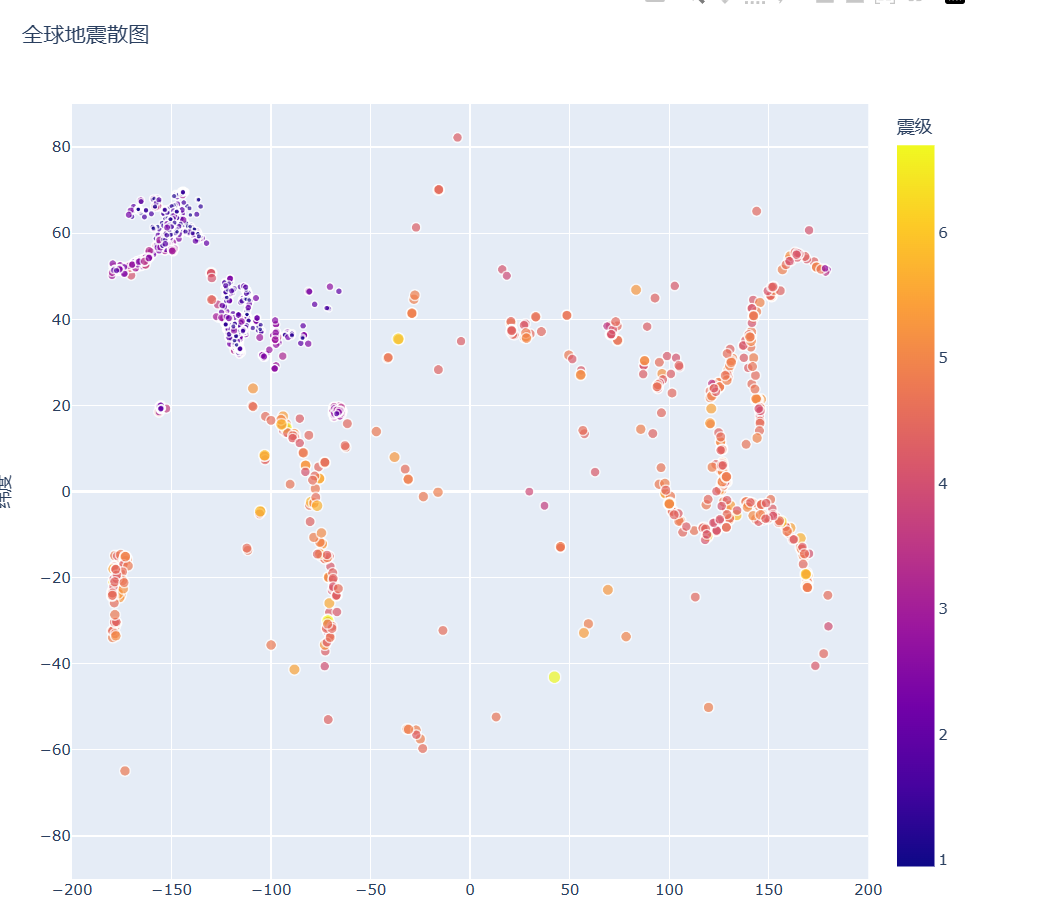
filename = "地震图/data/eq_data_30_day_m1.json"


"""size将震级传递给size表示依照震级的大小来自动调节大小

color将字段传递给它,就会依照大小来渐变颜色默认是蓝到红再到黄
还可以使用hover_name来标记鼠标指向时显示的文本
"""
fig = px.scatter(
    data,
    x="经度",
    y="纬度",
    labels={"x":"经度","y":"纬度"},
    range_x = [-200,200],
    range_y=[-90,90],
    width=800,
    height=800,
    title="全球地震散图",
    size='震级',
    size_max = 10,
    color='震级'
)

fig.write_html("地震图/data/global_earthquakes.html")
fig.show()
6.使用Web API
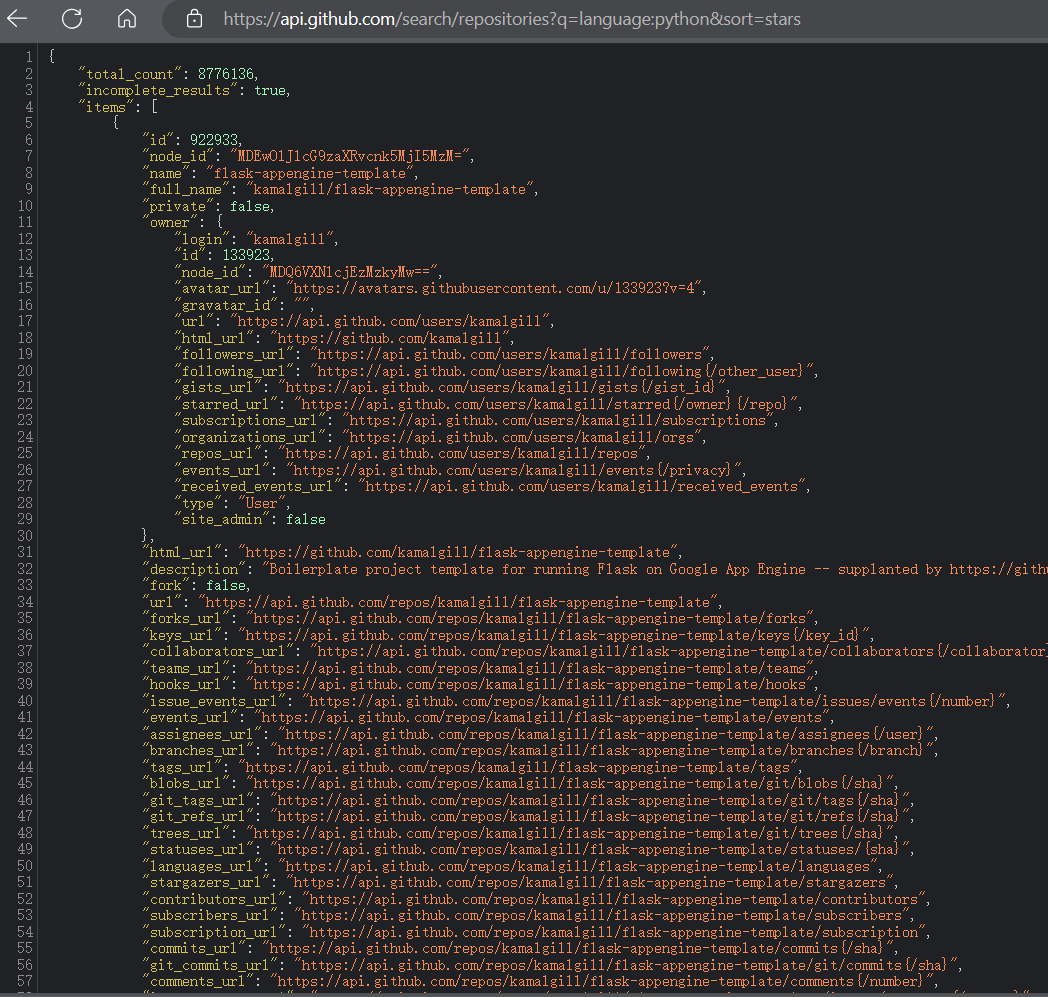
"""
https://api.github.com/ 将请求发送到GitHub网站中响应API
调用的部分, 接下来的search/repositories 让API搜索GitHub
上的所有仓库。
repositories 后面的问号指出需要传递一个实参。 q 表示查询,
而等号(= ) 让我们能够开始指定查询。 我们使
用language:python 指出只想获取主要语言为Python的仓库的信
息。 最后的&sort=stars 指定将项目按星级排序。
"""

1.total_count表示github上现在又8776136个python项目
2.items显示了包含最受欢迎项目的详细信息
1.1处理API响应
import requests
"""需要调用的URL"""
url =  "https://api.github.com/search/repositories?q=language:python&sort=stars"
"""请求头部,请求github API V3版本"""
headers = {'Accept':'application/vnd.github.v3+json'}
"""使用get"""
r = requests.get(url,headers=headers)
"""打印status_code,查看是否调用成功"""
print(f"Status code:{r.status_code}")
"""将获取到的数据装欢为json,也就是字典存储"""
response_dict = r.json()
"""打印字典中的所有键"""
print(response_dict.keys())
Status code:200
dict_keys(['total_count', 'incomplete_results', 'items'])
1.2处理响应字典
import requests
"""需要调用的URL"""
url =  "https://api.github.com/search/repositories?q=language:python&sort=stars"
"""请求头部,请求github API V3版本"""
headers = {'Accept':'application/vnd.github.v3+json'}
"""使用get"""
r = requests.get(url,headers=headers)
"""打印status_code,查看是否调用成功"""
print(f"Status code:{r.status_code}")
"""将获取到的数据装欢为json,也就是字典存储"""
response_dict = r.json()
# """打印字典中的所有键"""
# print(response_dict.keys())
print(f"Github中的python项目总数:{response_dict['total_count']}")

repo_dicts = response_dict['items']
print(f"获取到几个仓库信息:{len(repo_dicts)}")


"""第一个仓库"""
repo_dict = repo_dicts[0]
print(f"\nkeys: {len(repo_dict)}" )
for key in sorted(repo_dict.keys()):
    print(key)
Status code:200
Github中的python项目总数:8609060
获取到几个仓库信息:30

keys: 80
allow_forking
archive_url
archived
assignees_url
blobs_url
branches_url
clone_url
.......
svn_url
tags_url
teams_url
topics
trees_url
updated_at
url
visibility
watchers
watchers_count
web_commit_signoff_required
打印第一个仓库信息
import requests
"""需要调用的URL"""
url =  "https://api.github.com/search/repositories?q=language:python&sort=stars"
"""请求头部,请求github API V3版本"""
headers = {'Accept':'application/vnd.github.v3+json'}
"""使用get"""
r = requests.get(url,headers=headers)
"""打印status_code,查看是否调用成功"""
print(f"Status code:{r.status_code}")
"""将获取到的数据装欢为json,也就是字典存储"""
response_dict = r.json()
# """打印字典中的所有键"""
# print(response_dict.keys())
print(f"Github中的python项目总数:{response_dict['total_count']}")

repo_dicts = response_dict['items']
print(f"获取到几个仓库信息:{len(repo_dicts)}")


"""第一个仓库"""
repo_dict = repo_dicts[0]
print(f"\nkeys: {len(repo_dict)}" )
# for key in sorted(repo_dict.keys()):
#     print(key)
"""获取第一个仓库的名字,拥有者,他的stars数量"""
print(f"Name: {repo_dict['name']}")
print(f"Own: {repo_dict['owner']['login']}")
print(f"Stars: {repo_dict['stargazers_count']}")
print(f"Repository: {repo_dict['html_url']}")
print(f"Created: {repo_dict['created_at']}")
print(f"Updated: {repo_dict['updated_at']}")
print(f"Description: {repo_dict['description']}")
keys: 80
Name: youtube-dl
Own: ytdl-org
Stars: 123900
Repository: https://github.com/ytdl-org/youtube-dl
Created: 2010-10-31T14:35:07Z
Updated: 2023-10-13T11:18:56Z
Description: Command-line program to download videos from YouTube.com and other video sites
1.3打印出start>10000所有仓库的信息
Status code:200
Github中的python项目总数:412
获取到几个仓库信息:30
Name: public-apis
Own: public-apis
Stars: 259946
Repository: https://github.com/public-apis/public-apis
Description: A collective list of free APIs
Name: system-design-primer
Own: donnemartin
Stars: 231407
Repository: https://github.com/donnemartin/system-design-primer
Description: Learn how to design large-scale systems. Prep for the system design interview.  Includes Anki flashcards.
Name: awesome-python
Own: vinta
Stars: 183478
Repository: https://github.com/vinta/awesome-python
Description: A curated list of awesome Python frameworks, libraries, software and resources
Name: Python
Own: TheAlgorithms
Stars: 170898
Repository: https://github.com/TheAlgorithms/Python
Description: All Algorithms implemented in Python
Name: Python-100-Days
Own: jackfrued
Stars: 141228
Repository: https://github.com/jackfrued/Python-100-Days
Description: Python - 100天从新手到大师
Name: youtube-dl
Own: ytdl-org
Stars: 123899
Repository: https://github.com/ytdl-org/youtube-dl
Description: Command-line program to download videos from YouTube.com and other video sites
Name: transformers
Own: huggingface
Stars: 113235
Repository: https://github.com/huggingface/transformers
Description: 🤗 Transformers: State-of-the-art Machine Learning for Pytorch, TensorFlow, and JAX.
Name: stable-diffusion-webui
Own: AUTOMATIC1111
Stars: 105507
Repository: https://github.com/AUTOMATIC1111/stable-diffusion-webui
Description: Stable Diffusion web UI
...............
Name: d2l-zh
Own: d2l-ai
Stars: 49607
Repository: https://github.com/d2l-ai/d2l-zh
Description: 《动手学深度学习》:面向中文读者、能运行、可讨论。中英文版被70多个国家的500多所大学用于教学。
Name: face_recognition
Own: ageitgey
Stars: 49546
Repository: https://github.com/ageitgey/face_recognition
Description: The world's simplest facial recognition api for Python and the command line
Name: localstack
Own: localstack
Stars: 49504
Repository: https://github.com/localstack/localstack
Description: 💻 A fully functional local AWS cloud stack. Develop and test your cloud & Serverless apps offline
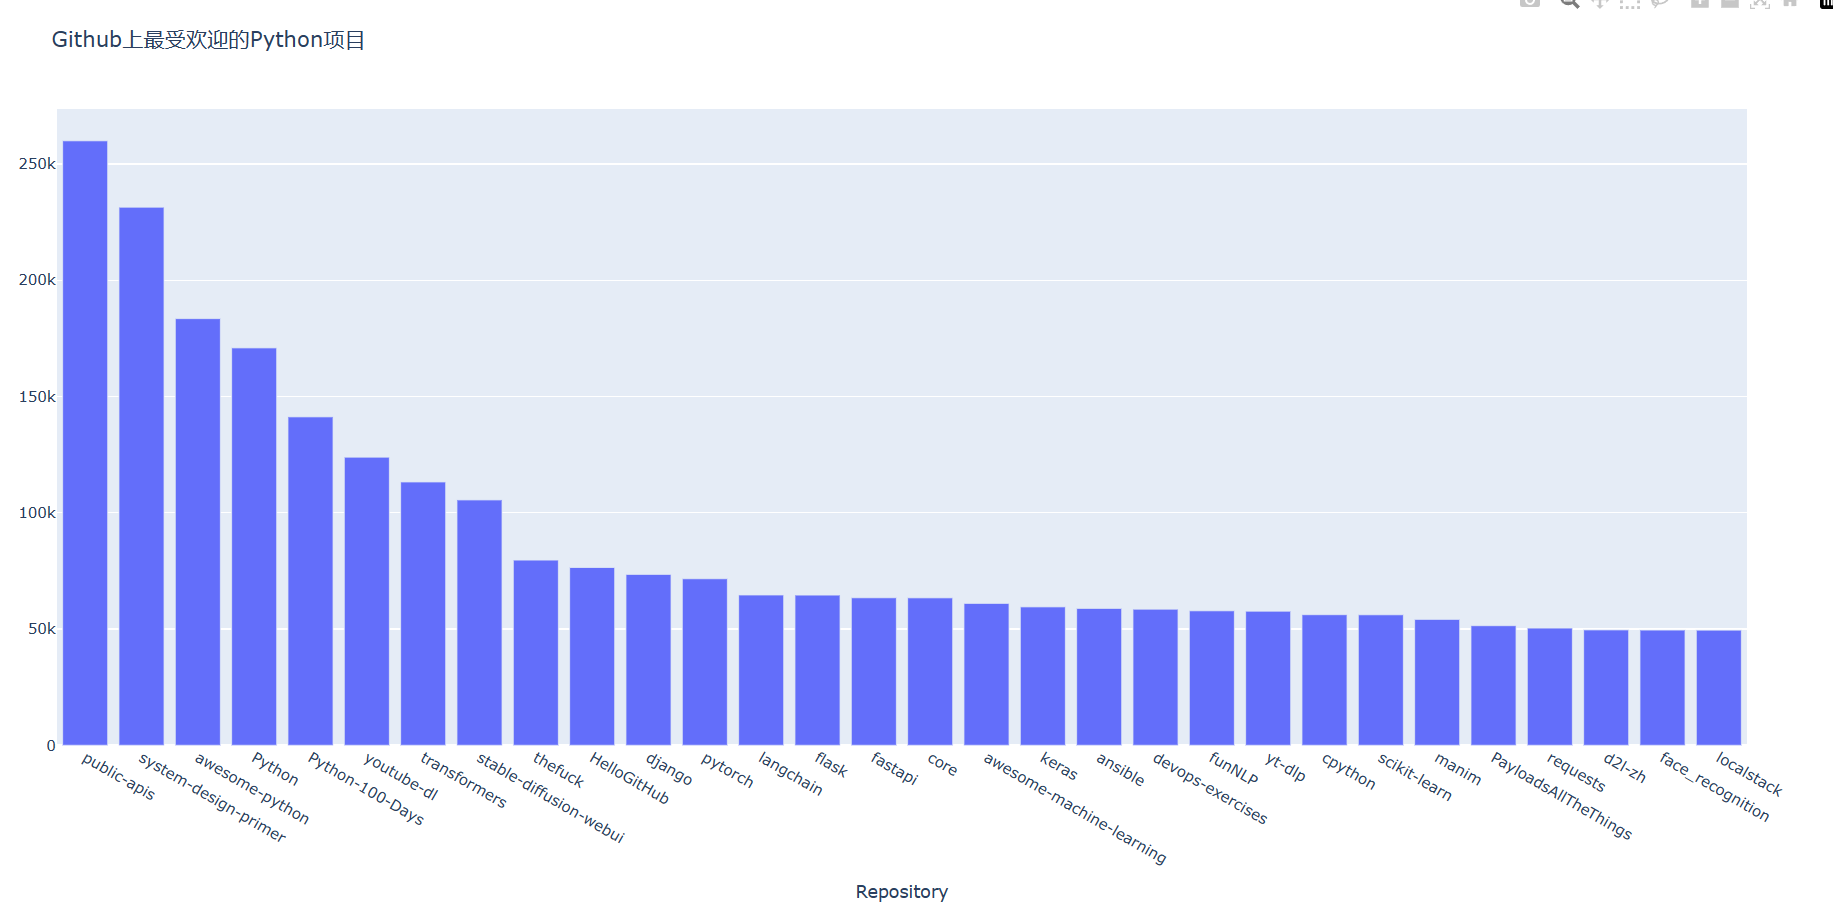
7.使用Plotly来可视化仓库
import requests
from plotly.graph_objs import Bar
from plotly import offline


"""需要调用的URL,表示搜索start大于10000的python项目数量"""
url =  "https://api.github.com/search/repositories?q=language:python+sort:stars+stars:>10000"
"""请求头部,请求github API V3版本"""
headers = {'Accept':'application/vnd.github.v3+json'}
"""使用get"""
r = requests.get(url,headers=headers)
"""打印status_code,查看是否调用成功"""
print(f"Status code:{r.status_code}")
"""将获取到的数据装欢为json,也就是字典存储"""
response_dict = r.json()
# """打印字典中的所有键"""
# print(response_dict.keys())
print(f"Github中的python项目总数:{response_dict['total_count']}")

repo_dicts = response_dict['items']
print(f"获取到几个仓库信息:{len(repo_dicts)}")


# """第一个仓库"""
# repo_dict = repo_dicts[0]
# print(f"\nkeys: {len(repo_dict)}" )
# for key in sorted(repo_dict.keys()):
#     print(key)
repo_names,stars = [],[]
for repo_dict in repo_dicts:
    repo_names.append(repo_dict['name'])
    stars.append(repo_dict['stargazers_count'])
#     """获取第仓库的名字,拥有者,他的stars数量"""
#     print(f"Name: {repo_dict['name']}")
#     print(f"Own: {repo_dict['owner']['login']}")
#     print(f"Stars: {repo_dict['stargazers_count']}")
#     print(f"Repository: {repo_dict['html_url']}")
#     # print(f"Created: {repo_dict['created_at']}")
#     # print(f"Updated: {repo_dict['updated_at']}")
#     print(f"Description: {repo_dict['description']}")


data = [{
    'type':'bar',
    'x': repo_names,
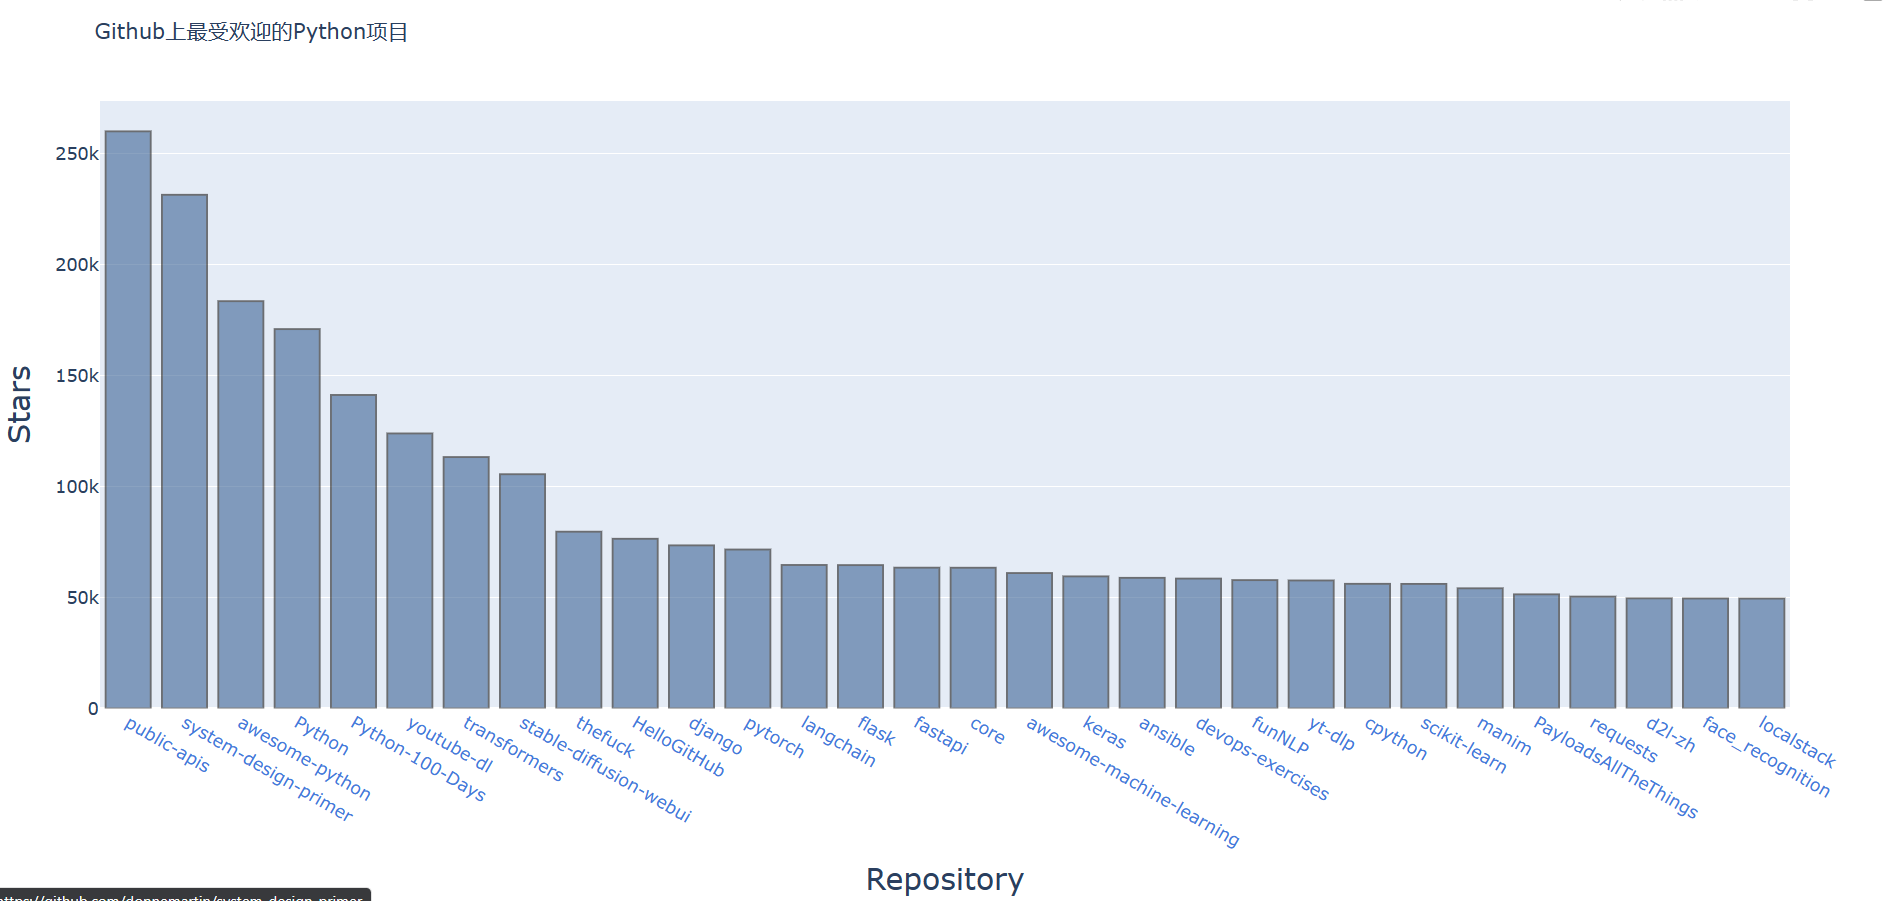
    'y':stars
}]

my_layout = {
    'title': "Github上最受欢迎的Python项目",
    'xaxis': {'title':"Repository"},
    'yaxis': {'title':"Stars"}
}


fig = {'data':data,'layout':my_layout}
offline.plot(fig,filename='WebAPI/python_repos.html')
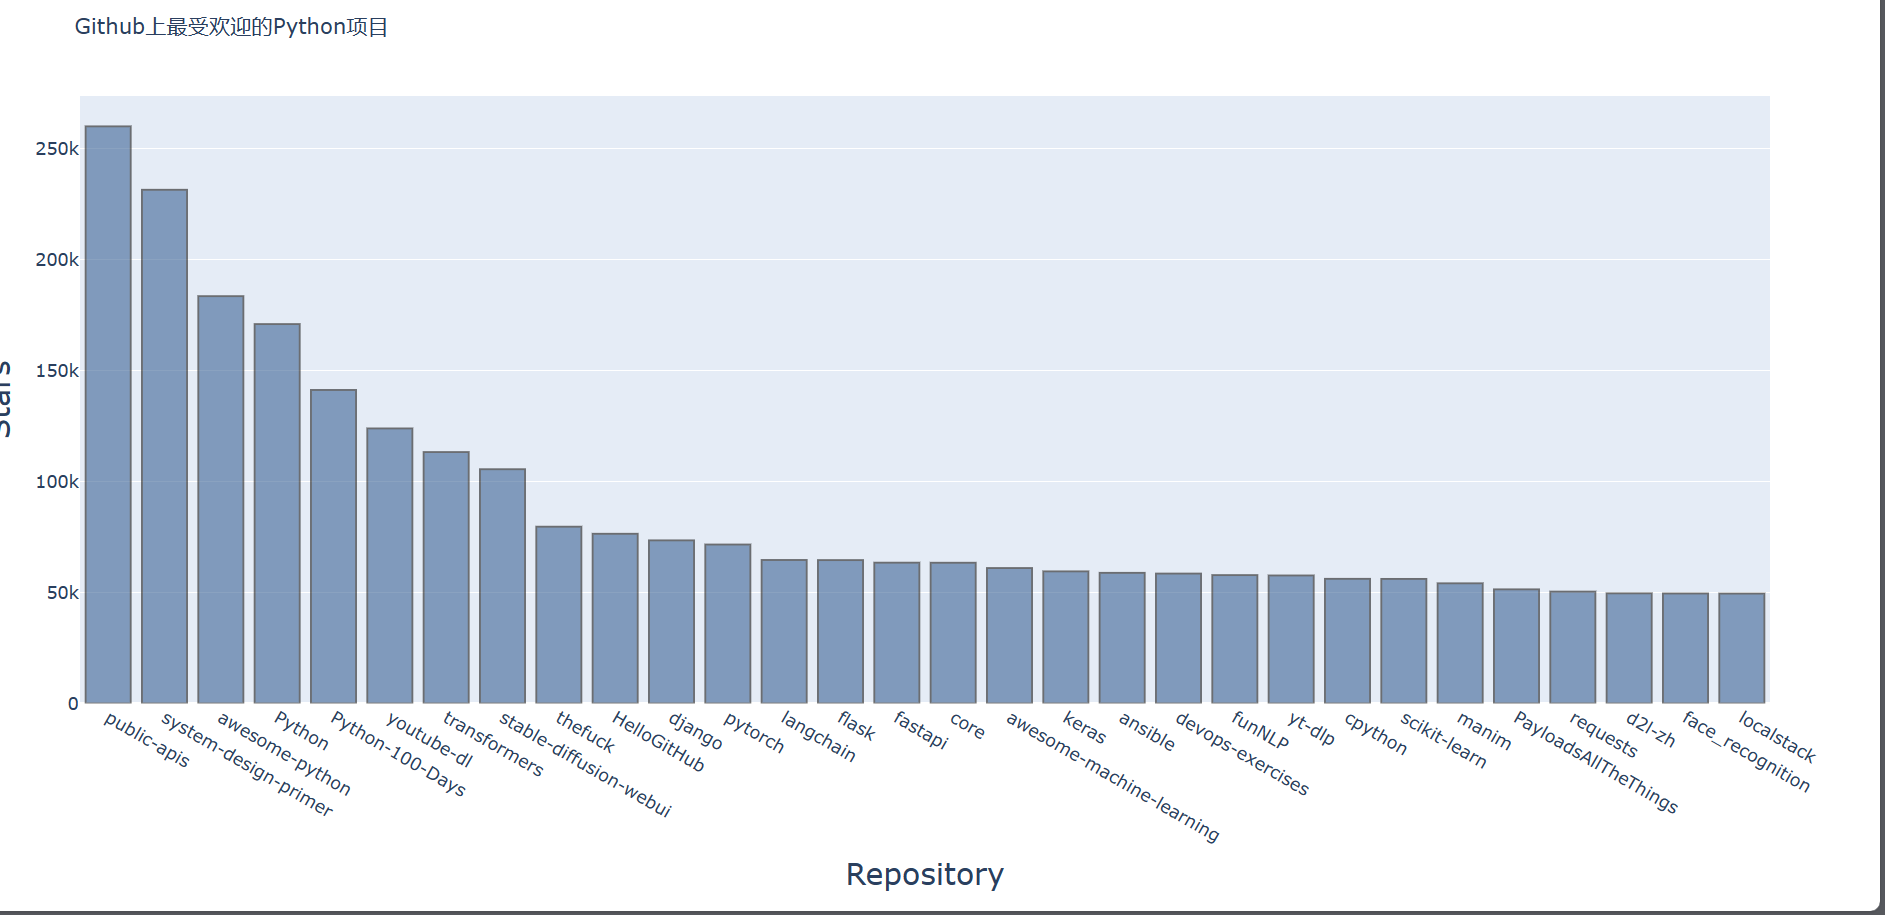
7.1改进Plotly表
data = [{
    'type':'bar',
    'x': repo_names,
    'y':stars,
    'marker':{
        'color':'rgb(60,100,150)',
        'line':{'width':1.5,'color':'rgb(25,25,25)'}
    },
    'opacity':0.6
}]

my_layout = {
    'title': "Github上最受欢迎的Python项目",
    'xaxis': {'title':"Repository",
              'titlefont':{'size':24},
              'tickfont':{'size':14}
              },
    'yaxis': {'title':"Stars",
              'titlefont':{'size':24},
              'tickfont':{'size':14}
              }
}


fig = {'data':data,'layout':my_layout}
offline.plot(fig,filename='WebAPI/python_repos.html')
7.2添加自定义工具提示和项目名链接
    """添加可点击URL"""
    repo_name = repo_dict['name']
    link = repo_dict['html_url']
    """添加HTML的URL标签"""
    repo_link = f"<a href='{link}'>{repo_name}</a>"
    links.append(repo_link)
    ......

    """数据,maker设置数据线条颜色,hovertext导入label数据"""
data = [{
    'type':'bar',
    'x': links,
    'y':stars,
    'hovertext': labels,
    'marker':{
        'color':'rgb(60,100,150)',
        'line':{'width':1.5,'color':'rgb(25,25,25)'}
    },
    'opacity':0.6
}]


my_layout = {
    'title': "Github上最受欢迎的Python项目",
    'xaxis': {'title':"Repository",
              'titlefont':{'size':24},
              'tickfont':{'size':14}
              },
    'yaxis': {'title':"Stars",
              'titlefont':{'size':24},
              'tickfont':{'size':14}
              }
}


fig = {'data':data,'layout':my_layout}
offline.plot(fig,filename='WebAPI/python_repos.html')
现在点击x轴名就可以自动调整到该项目下地址,鼠标指向数据就会显示数据名he
